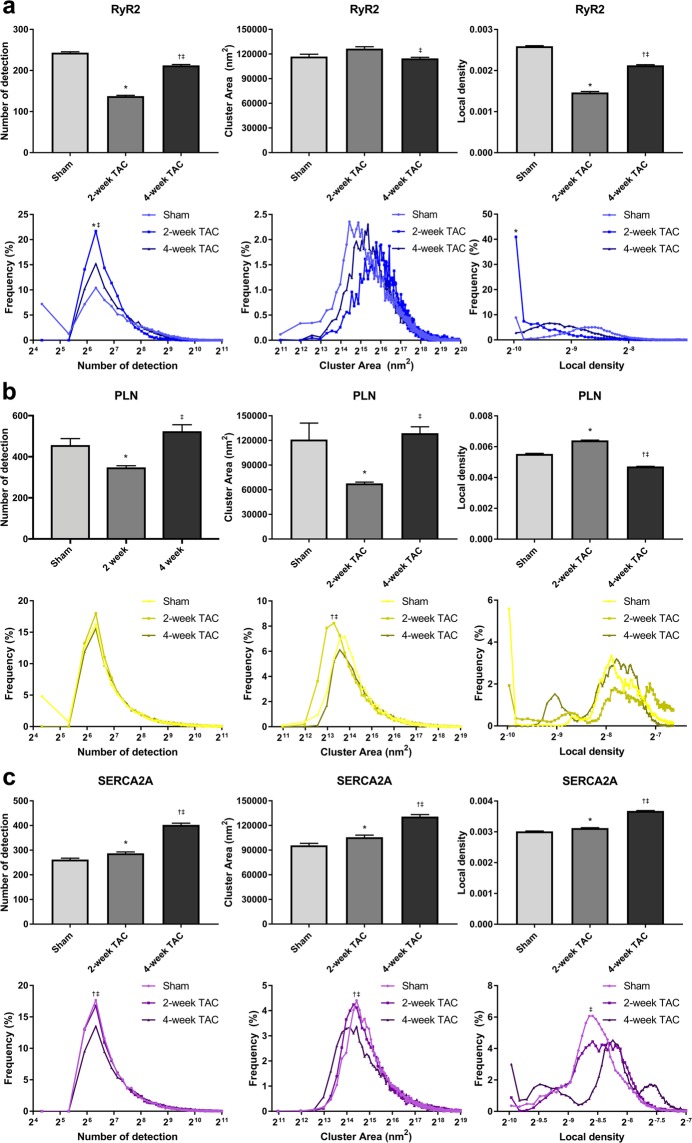
Figure 7.
Quantitative Voronoi tessellation analysis yields distinct changes in protein cluster properties with TAC. (a–c) Average and distribution curves for number of localizations per protein cluster, cluster area, and cluster density in sham, 2-week, and 4-week TAC cardiomyocytes were determined via Voronoi tessellation and plotted for (a) RyR2, (b) PLN and (c) SERCA2A using a region of interest which encapsulated the whole cell. Sample size:10–12 cells per protein per condition, n = 3; *p < 0.05 sham vs 2-week, †p < 0.05 sham vs 4-week, ‡p < 0.05 2-week vs 4-week.

