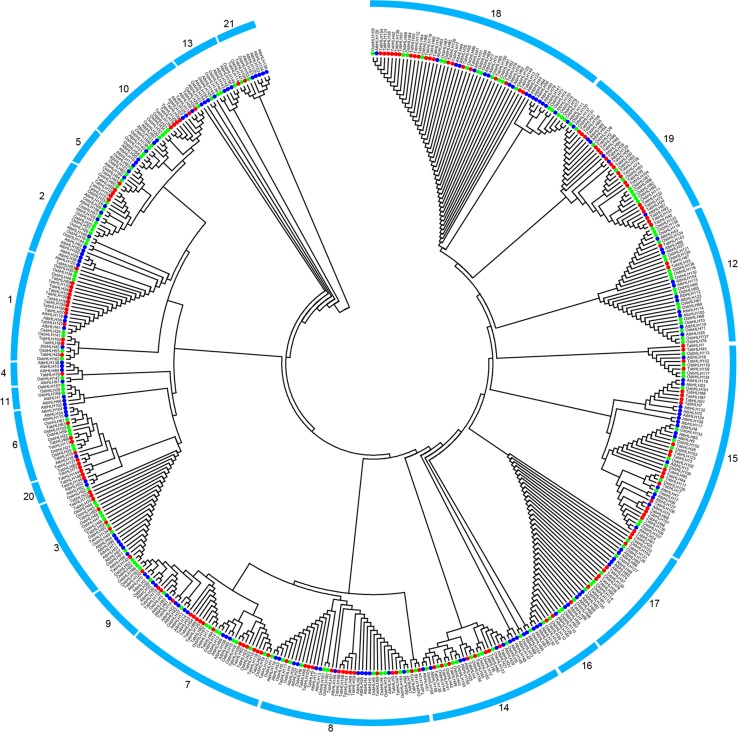
Fig. 1.
Phylogenetic analysis of bHLH proteins of wheat, rice and A. thaliana. The maximum-likelihood (ML) tree was constructed using Clustal X 2.0 and MEGA 5.0 softwares. Signs of different shapes represent bHLH proteins from wheat (red round, Ta), rice (green round, Os) and A. thaliana (blue round, At)

