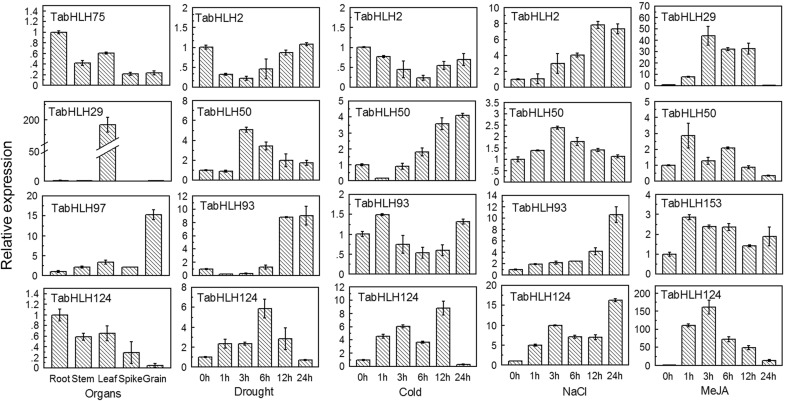
Fig. 4.
Validation of the expression level of TabHLHs by qRT-PCR analyses. The relative expression levels of selected TabHLHs in different organs, under drought, cold, salt and MeJA treatments. The mRNA fold difference was relative to that of root samples for organs special expression and untreated samples for different stress treatments expression used as calibrator. Data are mean ± SD of n = 3 biological replicates

