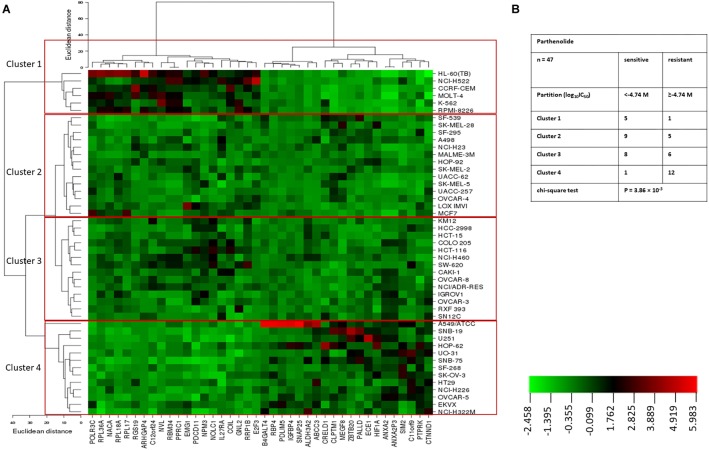
FIGURE 2.
(A) Heat map obtained by hierarchical cluster analysis of transcriptome-wide expression profiling of 47 NCI tumor cell lines correlating to sensitivity and resistance toward parthenolide. (B) Clusters of NCI tumor cell lines gained by hierarchical cluster analyses for parthenolide. The median log10IC50 value (M) for parthenolide was used as cut-off to classify tumor cell lines as being “sensitive” or “resistant.”

