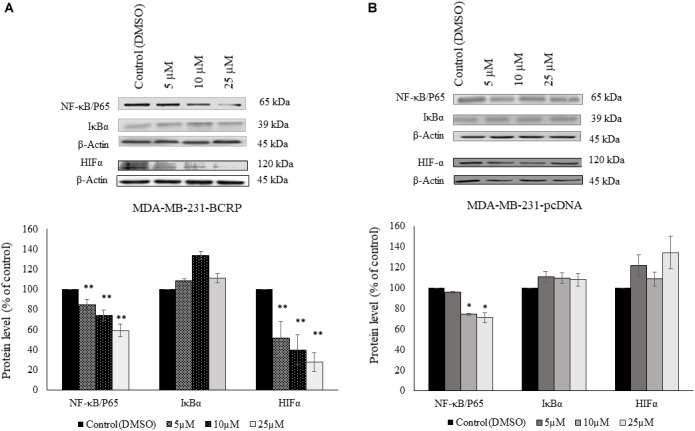
FIGURE 6.

Western blot analysis of NF-κB, IκB, and HIF-1α in parthenolide-treated multidrug-resistant MDA-MB-231-BCRP and sensitive MDA-MB-231-pcDNA3 cell lines (A) represents protein analysis for MDA-MB-231-BCRP while (B) represents protein analysis for MDA-MB-231-pcDNA. Cells were incubated with 5, 10, and 25 μM parthenolide and DMSO as negative control for 6 h. Then, total protein was extracted and Western blotting was performed. The chart shows the change in the protein expression after normalization to β-actin as mean ± SD for two independent experiments. Asterisk (∗) indicates statistical significant inhibition (p < 0.05) while two asterisks (∗∗) indicate statistical significant (p < 0.01) compared to DMSO-treated control cells.
