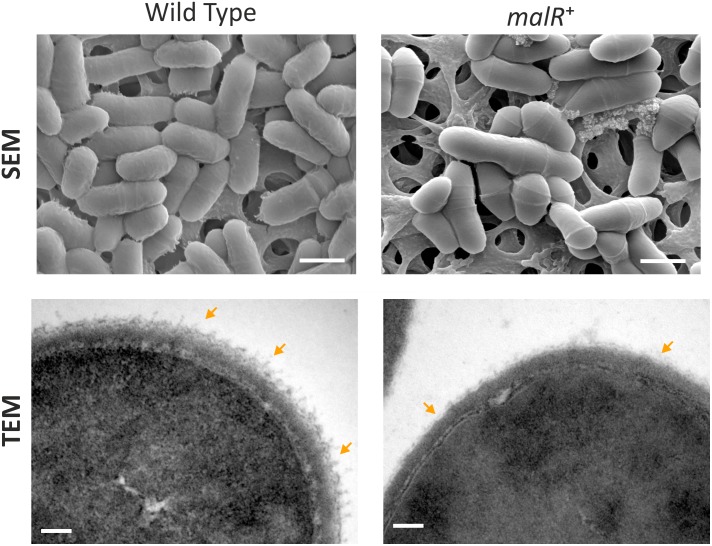
FIGURE 5.
C. glutamicum cells overproducing MalR show an altered cell surface structure. Shown are SEM and TEM microscopy pictures of wild type cells and cells overproducing the MalR protein. SEM pictures are 15000 x magnified; TEM pictures 167000×. For microscopic analysis, cells were cultivated in CGXII minimal medium containing 2% (w/v) glucose and malR expression was induced by adding 100 μM IPTG. Cells were fixed using 3% Glutaraldehyde in Sörensen phosphate buffer.

