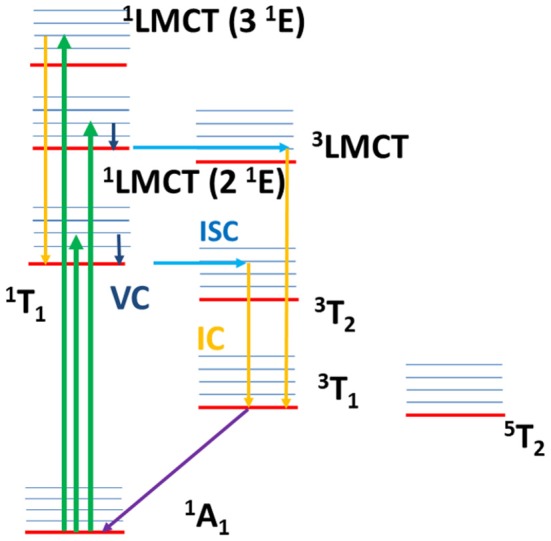
Figure 12.

Jablonski diagram with the sketch of the excited state dynamics. The arrows explain qualitatively the dynamics: absorption transitions (green arrows), internal conversion (yellow arrows), intersystem crossing (light blue arrows), vibrational cooling (dark blue arrows), non-radiative decay toward the ground state (violet arrow). After ligand field excitation (1T1), VC and ISC occur with an overall lifetime 0.07 ± 0.04 ps and, successively, IC toward the lower triplet state and relaxation toward the ground state with a lifetime 1.8 ± 0.3 ps. The same dynamics is proposed for the 1LMCT (2 1E) excitation, with VC and ISC (1LMCT → 3LMCT) overall lifetime 0.08 ± 0.04 ps, and IC and non-radiative relaxation overall lifetime 1.5 ± 0.3 ps. For 1LMCT (3 1E) excitation the calculations assign an ISC lifetime about 1 ps, slower than the experimental rise time 0.07 ± 0.04 ps. A fast IC toward the first singlet excited state and a fast singlet-triplet ISC is suggested to be associated with the fast experimental lifetime. The decay toward the ground state is sketched by IC within the triplet states and non-radiative decay with lifetime 1.5 ± 0.3 ps.
