Figure 7.

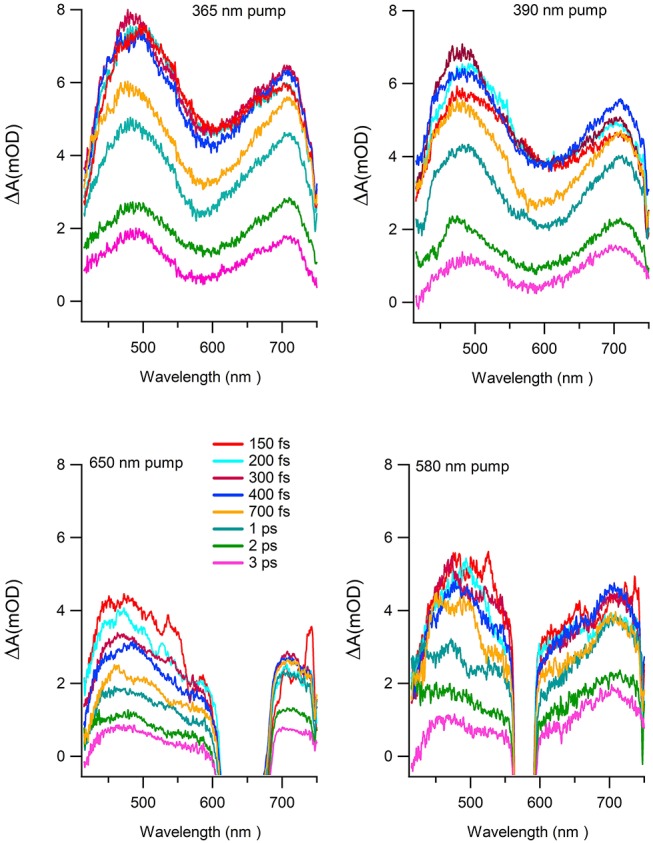
TA spectra as a function of wavelength at different delay times for the following excitation wavelength: 365 nm (upper left panel), 390 nm (upper right panel), 650 nm (lower left panel), 580 nm (lower right panel).

TA spectra as a function of wavelength at different delay times for the following excitation wavelength: 365 nm (upper left panel), 390 nm (upper right panel), 650 nm (lower left panel), 580 nm (lower right panel).