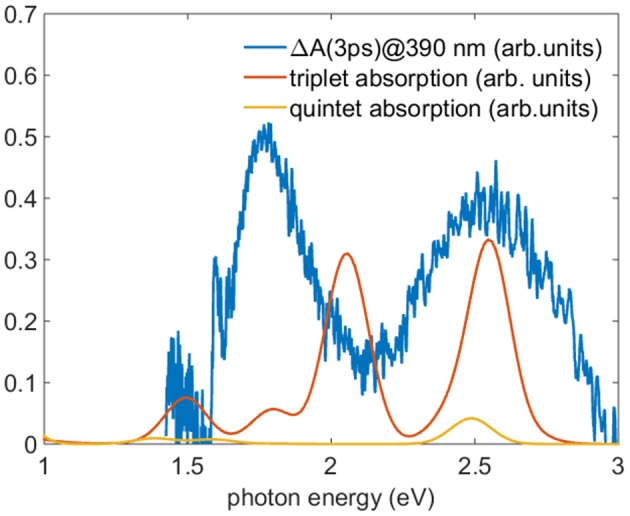
Figure 9.

Comparison between the TA spectrum acquired 3 ps after the 390 nm excitation (blue line) and the TDDFT calculated absorption in acetonitrile of the lowest level of the triplet (red line) and quintet (yellow line). To reproduce the absorption the oscillator strength were convoluted with a gaussian function with standard deviation of 100 meV and the energy of the theoretical calculation shifted of 300 meV toward lower energy.
