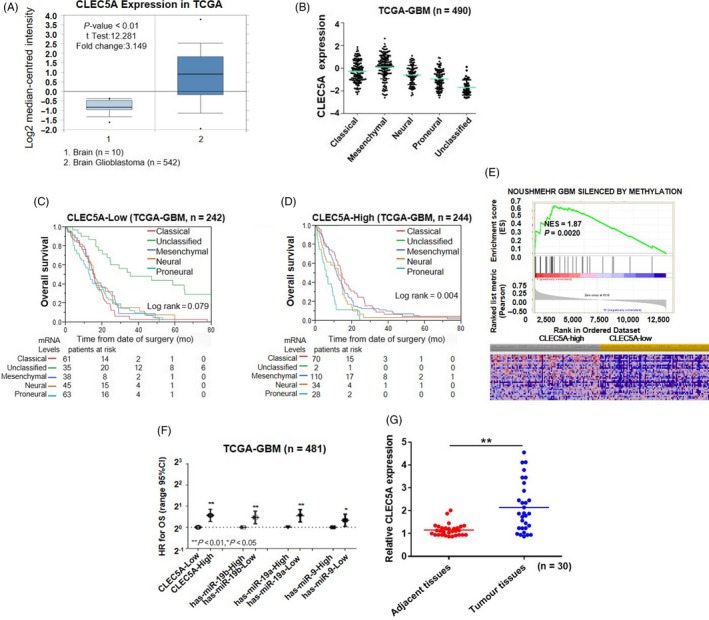
Figure 1.

CLEC5A mRNA expression pattern in brain glioblastoma from public database. A, TCGA (n = 552) analysis of CLEC5A mRNA expression in brain glioblastoma tissues from brain patients and brain glioblastoma, showing P‐values <10‐4. The median‐centred intensity log2 expression values of CLEC5A were −0.826 in brain (n = 10) and 0.916 in brain glioblastoma (n = 542), P value was 6.08E‐9, t test was 12.281, fold change was 3.149. B, Kaplan‐Meier analysis for subtype of brain glioblastoma in TCGA‐GBM (log‐rank P = 0.079) (OS) of CLEC5A‐Low (C) and Log‐rank P = 0.0042 (OS) of CLEC5A‐High. D, P value calculated using one‐way ANOVA, Cox regression analysis for subtype expression. E, Enriched gene signatures associated with prognosis in CLEC5A‐high and CLEC5A‐low brain glioblastomas. F, Comparison of prognostic performance of CLEC5A and has‐miR‐19b, has‐miR‐19a, has‐miR‐9 with age, MGMT status and G‐CIMP status in TCGA‐GBM microRNA dataset. G, Comparison of CLEC5A mRNA expression in glioblastoma tissues (n = 30) and adjacent normal tissues (n = 30) from patients in our institutes
