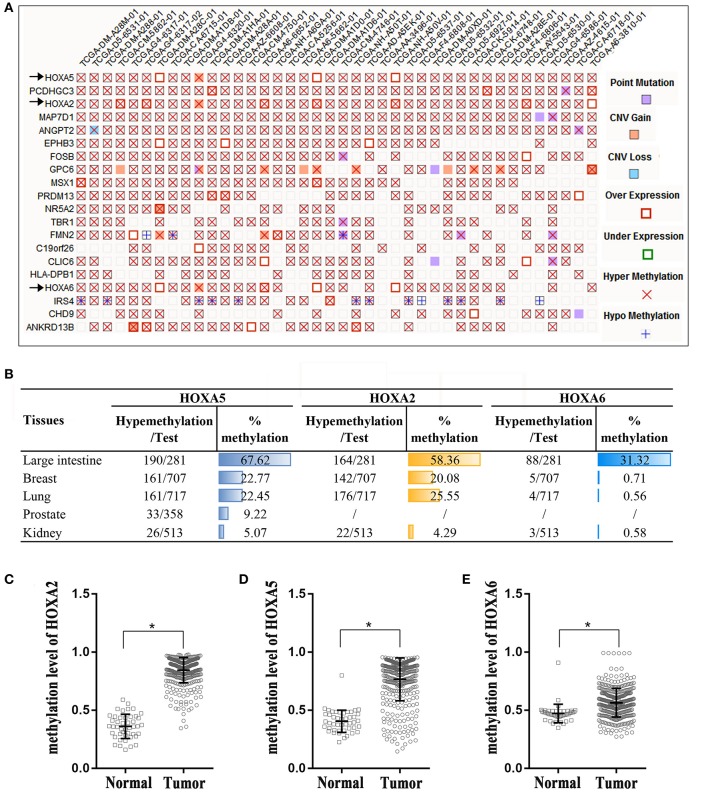
Figure 1.
High percentage of hypermethylation of the HOXA2, HOXA5, and HOXA6 genes in colorectal cancer tissue. (A) A “Mutation Matrix” plot between genes and samples for colorectal tissue that contains the top 20 ranked genes (rows) and TCGA samples (columns) with each box representing a Gene-Sample combination. HOXA2, HOXA5, and HOXA6 ranked 1, 3, and 17, respectively (only some TCGA samples are listed here; more details can be found on the COSMIC website). (B) The hypermethylation percentages (% me) are represented as histograms across the different primary tissue types, and the percentage of hypermethylation of HOXA2, HOXA5, and HOXA6 in the large intestine rank first. Test: Total number of samples analyzed (only some cancer samples are listed here; more details can be found on the COSMIC website). (C–E) HOXA2, HOXA5, and HOXA6 genes show increased methylation levels in colorectal cancer tissues compared with normal tissues (Unpaired t-test, *all p < 0.0001).

