Figure 6.
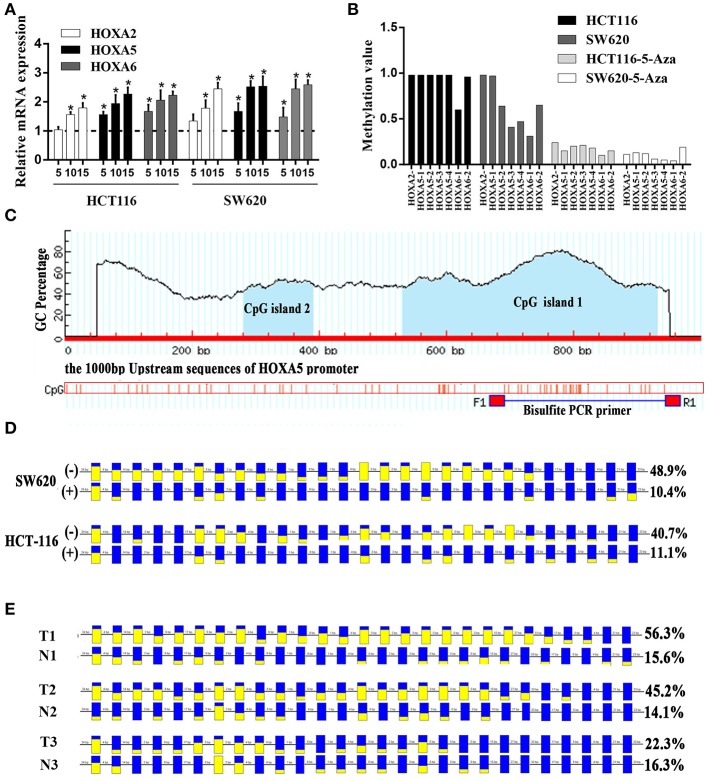
Promoter methylation responsible for the silencing of HOXA genes in colorectal cancer. (A) The relative expression of HOXA5 with (+) (5, 10, and 15 μmol/l) and without (–) 5-Aza treatment (set to 1) in colorectal cancer cells (Unpaired t-test). * indicates p < 0.05. (B) One CpG region from the CpG islands of HOXA2, 4 from HOXA5, and 2 from HOXA6 were sequenced in CRC cells with (+) (10μmol/l) and without (–) 5-Aza treatment. (C) MethPrimer (http://www.urogene.org/methprimer/index.html) predicts 2 CpG islands on 1,000 bp upstream promoter sequence of HOXA5 and design primers for Bisulfite-Sequencing PCR. (D) The result of BSP in colorectal cells SW620 and HCT-116 with (+) and without (–) 5-Aza treatment (10 umol/l). The data analyzed by BIQ Analyzer. Each square represents a CpG site. Yellow squares represent methylated CpG dinucleotides whereas blue squares represent unmethylated CpG sites. The ratios of the filled area in the squares represent the methylation status in the CpG sites. The number of base pairs between each CpG dinucleotide is indicated at the top. (E) The result of BSP in selected colorectal tissues including T1 and N1, T2 and N2 and T3 and N3. T: cancer tissue, N: adjacent normal tissue.

