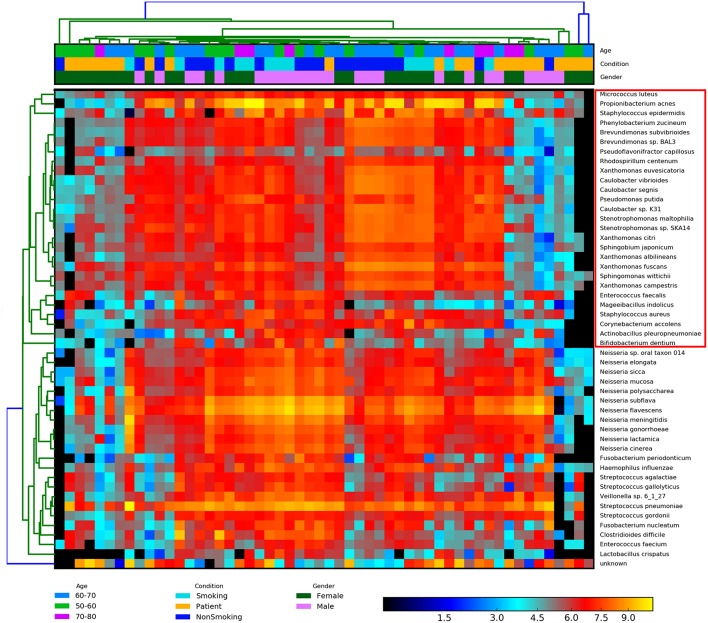
Figure 3.
Heatmap of the normalized abundances of all BALF samples. A similar grouping pattern on the combinations of the gender, age, and condition was also identified by Bray-Curtis matrix using the hclust2 and Mantel tests. The significant correlated of community structure of two groups was revealed (P-value = 0.01). The species in the red box are group 1, opportunistic pathogenic bacteria primarily derived from the skin and mouth, as mentioned above. The rest species are group 2, which is mainly from gut. Heatmap is color-coded based on the normalized abundance of species, from black (lower abundance) to red (higher abundance).

