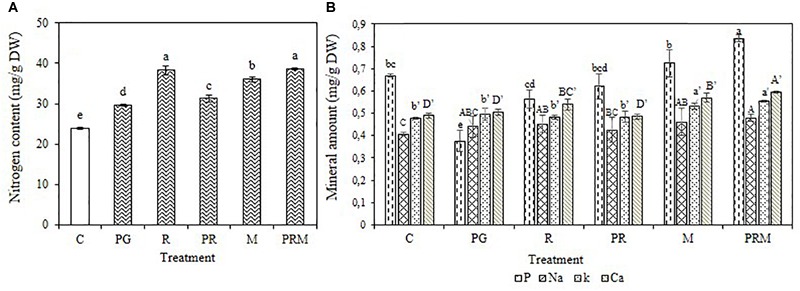
FIGURE 1.

Nitrogen content (A) and Mineral amount (B) in mg/g of dry matter of V. faba submitted to different treatments: C, control; PG, PGPR alone; R, rhizobia alone; PR, PGPR-rhizobia; M, AMF alone; PRM, PGPR-rhizobia-AMF. Means ( ± standard deviation) within the same graphic followed by different letters are significantly different at p < 0.05.
