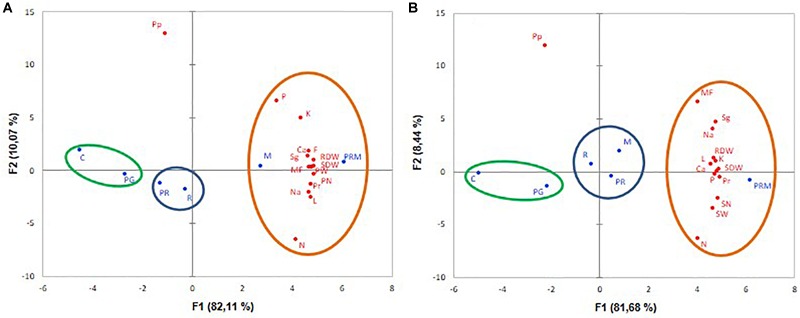
FIGURE 3.

Principal component analyses (PCA) of V. faba (A) and T. durum (B) submitted to different treatments: C, control; PG, PGPR alone; R, rhizobia alone; PR, PGPR-rhizobia; M, AMF alone; PRM, PGPR-rhizobia-AMF. The growth yield and nutrition variables are represented in red. The six treatments are given in blue. MF, mycorhization frequency; RDW, root dry weight; SDW, shoot dry weight; L, leaves number; F, flowers number; N, nitrogen content; P, phosphorus content; Na, sodium content; K, potassium content; Ca, calcium content: Sg, sugar content; Pr, protein content; Pp, polyphenol content; PN, pod number, PW, pod weight; SK, spike number, and SN, spite weight.
