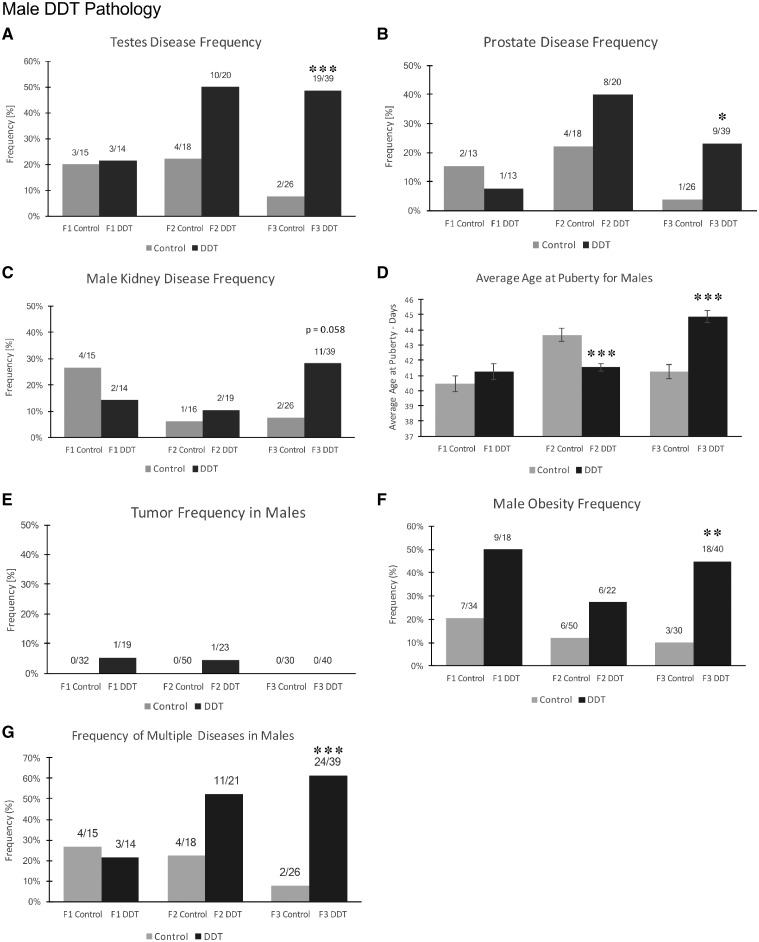
Figure 1:
pathology analysis in F1, F2, and F3 generation control and DDT lineage 1-year-old male rats. (A) Testis disease frequency, (B) prostate disease frequency, (C) male kidney disease frequency, (D) average age at puberty for males, (E) tumor frequency in males, (F) male obesity frequency, and (G) multiple disease. The pathology number ratio with total animal number is listed for each bar graph (A–G), statistical significance is represented with the P-value indicated (*P < 0.05; **P < 0.01; ***P < 0.001)

