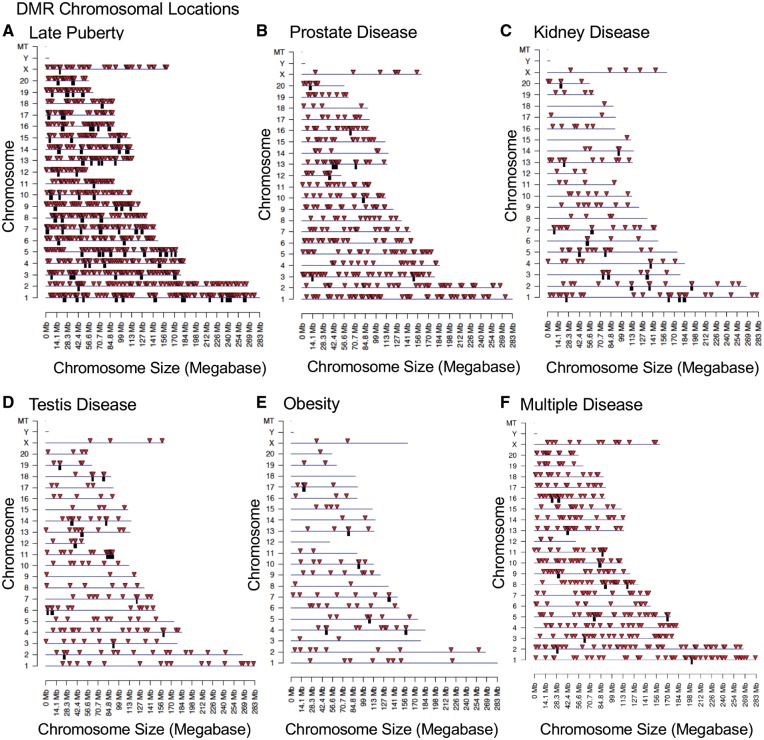
Figure 4:
chromosomal locations of disease-specific DMRs. DMR locations on the individual chromosomes are presented. (A) Late puberty, all DMRs at a P-value threshold of 1e-08 are shown. (B) Prostate disease, all DMRs at a P-value threshold of 1e-05 are shown. (C) Kidney disease, all DMRs at a P-value threshold of 1e-07 are shown. (D) Testis disease, all DMRs at a P-value threshold of 1e-05 are shown. (E) Obesity, all DMRs at a P-value threshold of 1e-05 are shown. (F) Multiple disease, all DMRs at a P-value threshold of 1e-05 are shown. The red arrowhead indicates the DMR location and black box a cluster of DMRs

