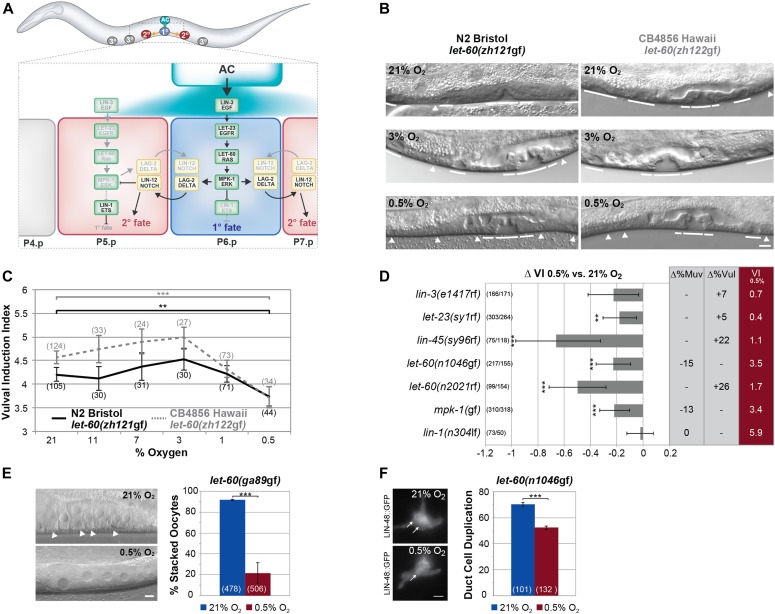
Figure 1. Hypoxia represses RAS/MAPK–mediated differentiation in different tissues.
(A) Overview of vulval development showing the known interactions between the RAS/MAPK and DELTA/NOTCH pathways. During the L2 stage, LIN-3 EGF activates the RAS/MAPK cascade in P5.p-P7.p. P6.p, in which RAS/MAPK activity is highest, adopts the 1° cell fate, and expresses DSL NOTCH ligands to activate LIN-12 NOTCH signaling in the adjacent Pn.p cells, which adopt the 2° fate. The uninduced P(3-4).p and P8.p cells adopt the 3° fate and fuse with the surrounding hypodermis. (B) Vulval phenotypes of the let-60 ras G13E mutation in the N2 Bristol (left) and CB4856 Hawaii (right) background with varying oxygen concentrations. Solid lines indicate induced 1° and 2° and arrowheads uninduced 3° VPCs in L4 larvae. (C) VI of N2 Bristol and CB4856 Hawaii let-60 ras G13E mutants raised in varying oxygen concentrations. (D) Effect of hypoxia on different RTK/RAS/MAPK pathway, bar-1(ga80), lin-12(n137), and lin-12(n137n720) mutants. ∆VI indicates the change in VI of animals raised in 0.5% compared with controls grown in 21% oxygen. ∆%Muv and ∆%Vul indicate the change in the percentage of animals with VI > 3 and VI < 3, respectively. The absolute VIs at 0.5% oxygen are shown in the rightmost red column. (E) Suppression of the stacked oocyte phenotype in let-60(ga89gf) animals raised at the restrictive temperature by hypoxia. Arrowheads point at the stacked oocytes formed in the proximal gonad under normoxia. (F) Suppression of the duct cell duplication phenotype in let-60(n1046gf) mutants by hypoxia. Arrows point at the duct cell nuclei expressing LIN-48::GFP formed under normoxia (top) and hypoxia (bottom). (C, D) Error bars in (C) and (D) indicate the 95% confidence intervals, and P-values, indicated with ***P < 0.001 and **P < 0.01, were derived by bootstrapping 1,000 samples. (E, F) In (E) and (F), error bars indicate the standard error of the mean, and P-values were calculated with a Fisher’s exact test. The numbers of animals scored are indicated in brackets. The scale bars represent 5 μm.

