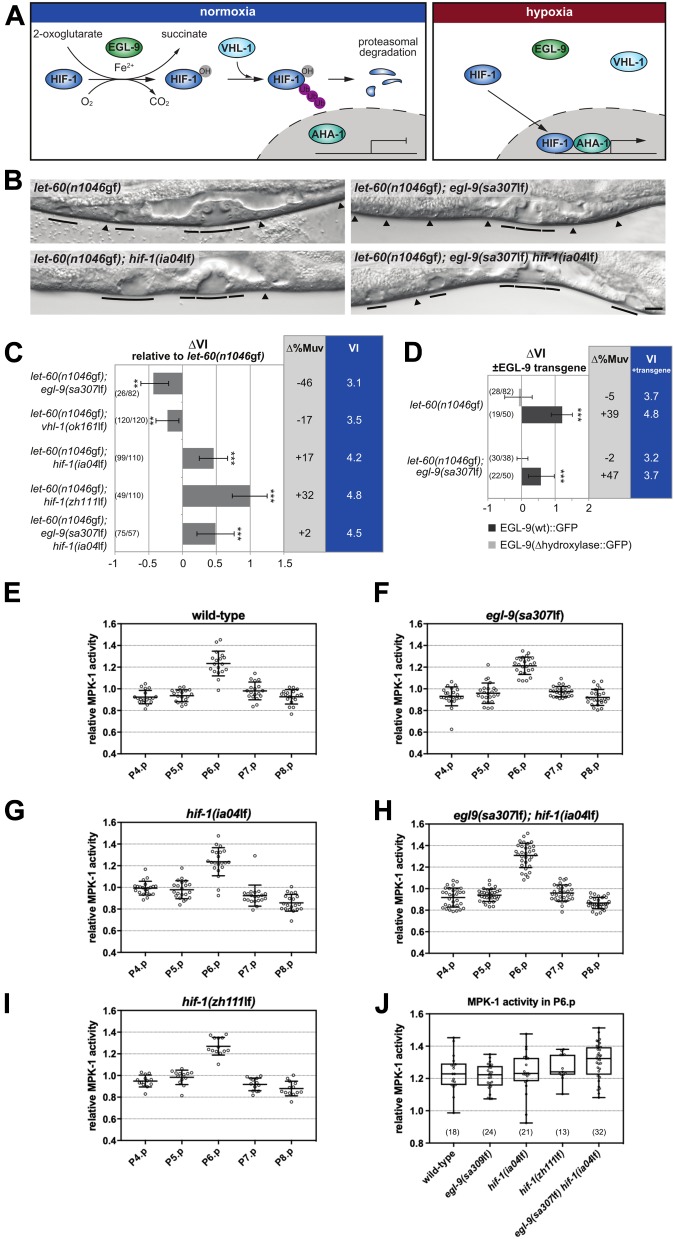
Figure 2. The hypoxia-response pathway negatively regulates VI under normoxia.
(A) Schematic overview of the conserved hypoxia-response pathway. The C. elegans gene names are indicated. (B) Vulval phenotypes of double and triple mutants between let-60(n1046gf) and components of the hypoxia-response pathway under normoxia. Solid lines indicate induced 1° and 2° and arrowheads uninduced 3° VPCs in the L4 larvae. (C) Mutations in the hypoxia-response pathway change the VI of let-60(n1046gf) mutants. ∆VI indicates the change in VI of the genotypes relative to let-60(n1046gf) single mutant siblings obtained from the crosses. ∆%Muv indicates the change in the percentage of animals with VI > 3. The absolute VIs of the double/triple mutants are shown in the rightmost blue column. (D) Overexpression of wild-type egl-9::gfp increases the VI. ∆VI indicates the change in VI of animals carrying a wild-type (dark bars) or hydroxylase deficient (light bars) multi-copy egl-9::gfp array compared with siblings without array. Error bars indicate the 95% confidence intervals. P-values, indicated with ***P < 0.001 and **P < 0.01, were derived by bootstrapping 1,000 samples. (E–I, J) MPK-1 biosensor (ERK-nKTR) activity values measured in the VPCs of mid-L2 larvae with the indicated mutant backgrounds and (J) comparison of the MPK-1 activity levels in P6.p across the different genotypes. Relative MPK-1 activity values were measured as described under the Materials and Methods section. The numbers of animals scored are indicated in brackets. The scale bar represents 5 μm.

