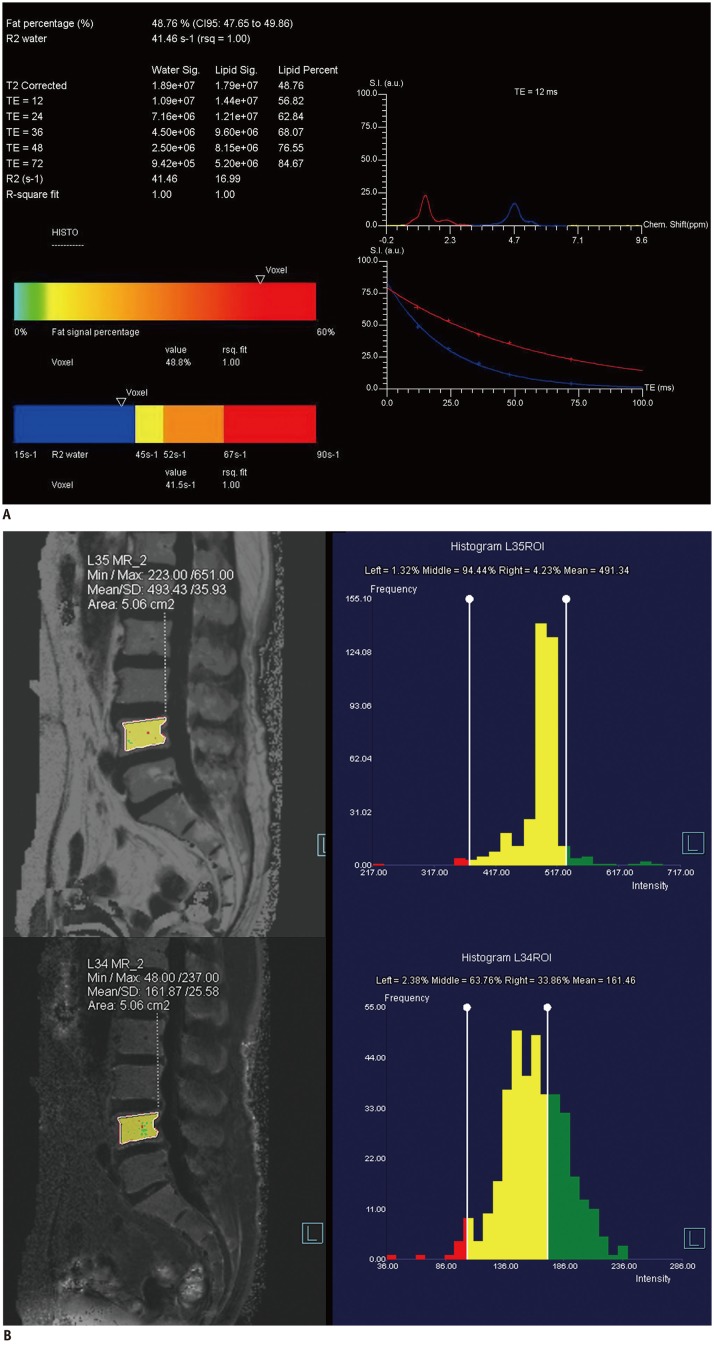
Fig. 1. 71-year-old female subject with lower back pain.
Screen-captured images of single-voxel T2-corrected multi-echo MRS (A) and T2*-corrected 6-echo Dixon VIBE imaging (B).
A. FF of single-voxel HISTO MRS scan. Each water and fat integral at five echoes (TE = 12, 24, 36, 48, and 72 ms; top left) with estimated FF of 48.8% (bottom left). Water and fat spectral peaks at TE of 12 ms are shown. Red curve represents 1.3-ppm fat spectrum, and blue curve represents 4.7-ppm water spectrum (top right). Image on right shows T2 exponential decay curve. Chem. = chemical, CI = confidence interval, FF = fat fraction, HISTO = high-speed T2-corrected multi-echo, MRS = magnetic resonance spectroscopy, rsq = r-squared, S.I. (a.u.) = signal intensity (arbitrary units), TE = echo time, VIBE = volumetric interpolated breath-hold examination B. Measurement of FF and R2* at MR imaging workstation (Syngo software; Siemens Healthineers). Free-drawn polygonal ROIs was located at least 2 mm from endplate and excluded basivertebral plexus. ROIs were drawn on fat-only images (top left) and directly copied onto R2* map (bottom right). FF and R2* are displayed as histograms (right). FF = fat fraction, MR = magnetic resonance, MRS = magnetic resonance spectroscopy, ROI = region of interest, SD = standard deviation, VIBE = volumetric interpolated breath-hold examination

