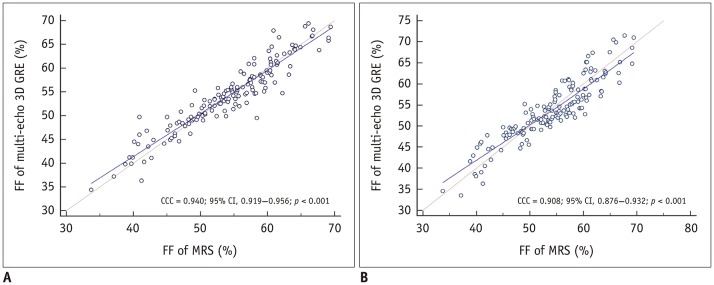
Fig. 2. Comparison between FF values measured with T2*-corrected 6-echo Dixon VIBE imaging and MRS at L4 vertebra.
pc for assessment of agreement between FF values measured via MRS and T2*-corrected 6-echo Dixon VIBE imaging (reader 1, A; reader 2, B). Correlation between spectroscopic and T2*-corrected 6-echo Dixon VIBE-based FF values was statistically significant for readers 1 and 2 (both p < 0.001). pc values for readers 1 and 2 were 0.940 and 0.908, respectively. CCC = concordance correlation coefficient, GRE = gradient echo, 3D = three-dimensional

