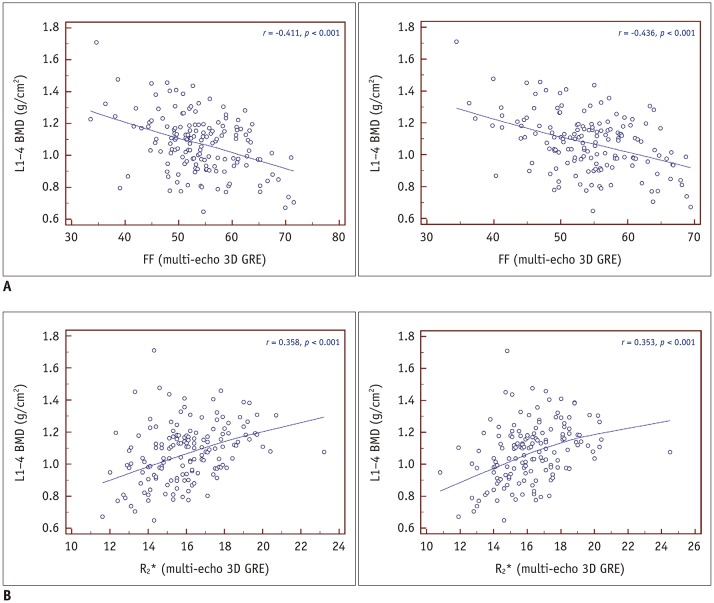
Fig. 3. Correlations between BMD and FF or R2*.
A. Scatterplot displaying correlation between FF obtained via T2*-corrected 6-echo Dixon VIBE imaging and areal BMD (g/cm2; reader 1, A-left; reader 2, A-right). Moderate negative correlation between FF and areal BMD was found (r = −0.411 [reader 1], −0.436 [reader 2]; both p < 0.001). B. Scatterplot displaying correlation between R2* and areal BMD (g/cm2; reader 1, B-left; reader 2, B-right). Weak positive correlation between R2* and areal BMD was found (r = 0.358 [reader 1], 0.353 [reader 2]; both p <0.001). BMD = bone mineral density

