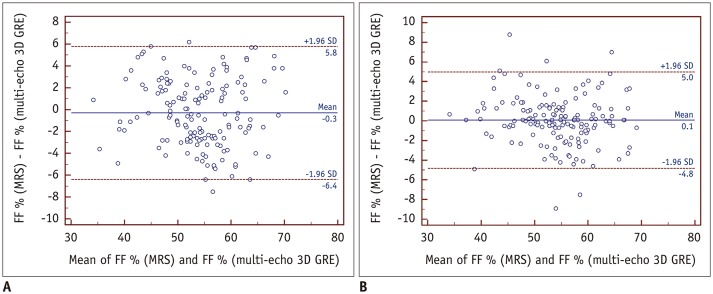
Fig. 4. Bland-Altman plots showing mean measurement bias with limits of agreement for FF derived from T2*-corrected 6-echo Dixon VIBE imaging relative to that measured with MRS.
Mean measurement bias for reader 1 (A) was −0.3% (range, −6.4–5.8%), and mean measurement bias for reader 2 (B) was 0.1% (range, −4.8–5.0%). Mean bias is shown as solid line, and limits of agreement are shown as dashed lines.

