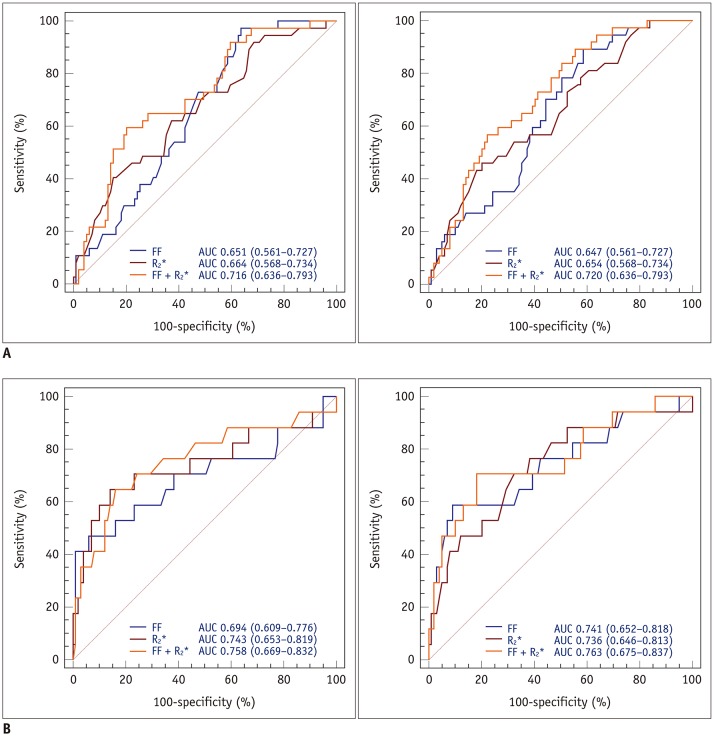
Fig. 5. Graphs showing ROC curves of readers 1 and 2 for predicting osteopenia (reader 1, A-left; reader 2, A-right) and osteoporosis (reader 1, B-left; reader 2, B-right) using FF, R2*, or combination of FF and R2*.
ROC analysis demonstrated that combination of FF and R2* improved diagnostic performance for predicting osteopenia and osteoporosis for both readers. AUC = area under curve, ROC = receiver operating characteristic

