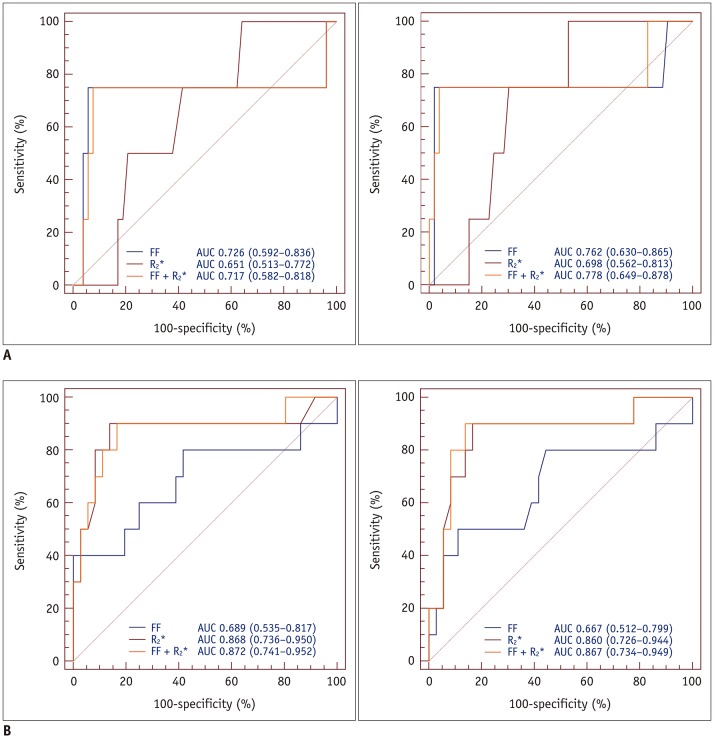
Fig. 7. ROC analysis of FF, R2*, and combination of FF and R2* for predicting osteopenia (reader 1, A-left; reader 2, A-right) and osteoporosis (reader 1, B-left; reader 2, B-right) in postmenopausal women.
ROC analysis demonstrated that AUCs for R2* were excellent for both readers. However, there was no significant difference in AUCs between FF, R2*, and combination of FF and R2*.

