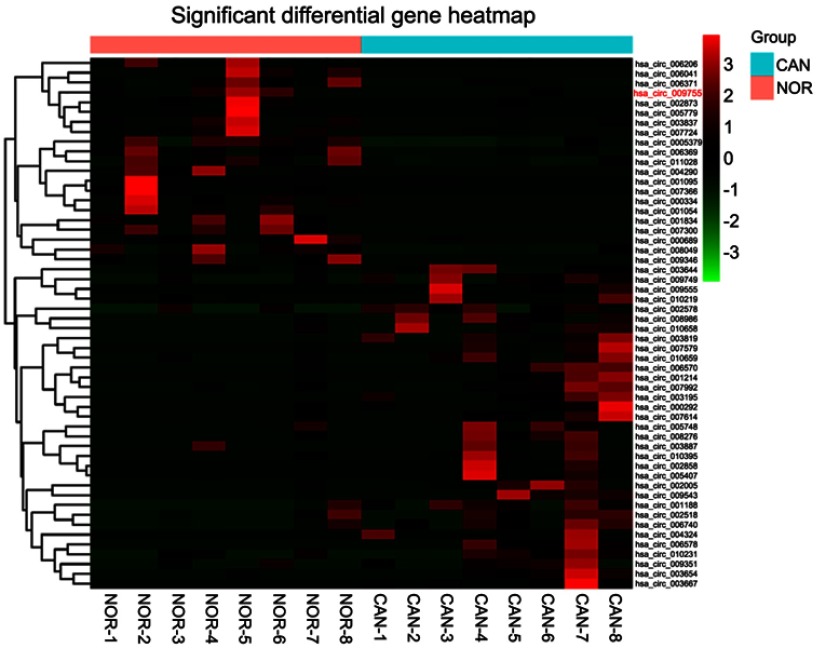
Figure 1.
Differentially expressed circRNAs between OSCC tissues and adjacent nontumorous tissues. The results of hierarchical cluster analysis showed that the differentiable expression profiles of circRNA between the samples (for OSCC, CAN, and NOR). Each column represents the expression of tissue samples. The expression level was indicated from “red” (high expression) to “green” (low expression).
Abbreviations: CAN, cancerous; NOR, normal adjacent nontumorous tissue; OSCC, oral squamous cell carcinoma.

