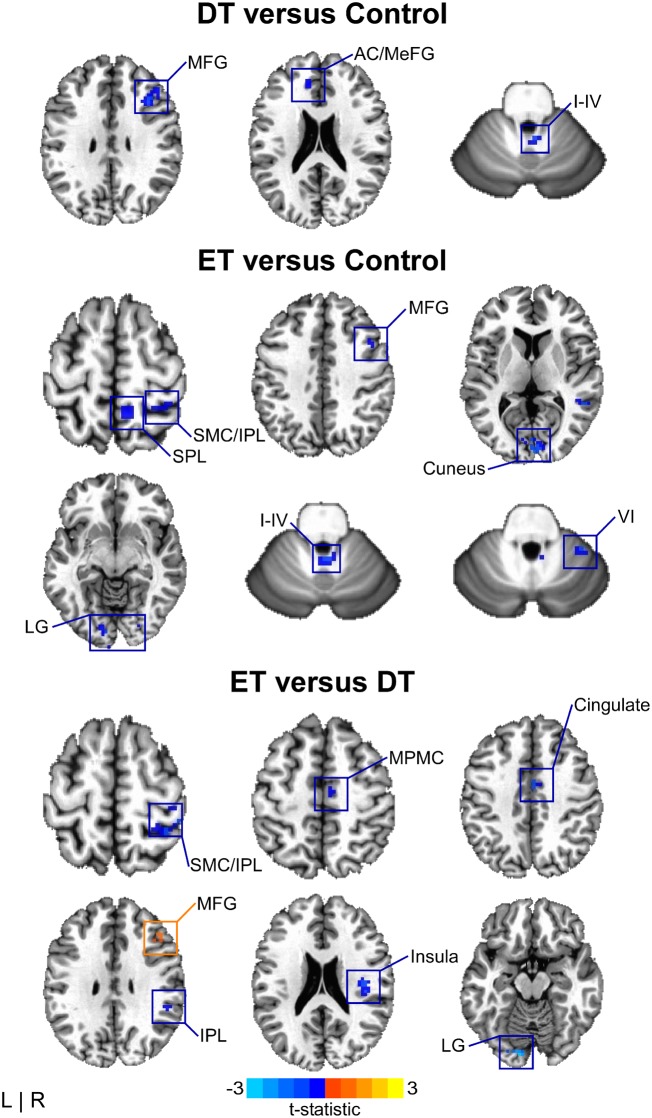
Figure 4.
BOLDΔ between-group effects. Spatial colour coded t-statistical maps representing the mean difference in BOLDΔ amplitude for dystonic tremor (DT) versus controls (top), essential tremor (ET) versus controls (middle), and essential tremor versus dystonic tremor (bottom). Results are thresholded at P < 0.05 FWER-corrected. Positive (yellow-orange-red) values, denote a significantly positive difference for the contrast of interest, whereas negative (blue) values represent a significantly negative difference. I–IV, VI = cerebellar lobules I–IV and VI, respectively; AC = anterior cingulate; IPL = inferior parietal lobule; LG = lingual gyrus; MeFG = medial frontal gyrus; MFG = middle frontal gyrus; MPMC = mesial premotor cortex; SMC = sensorimotor cortex; SPL = superior parietal lobule.

