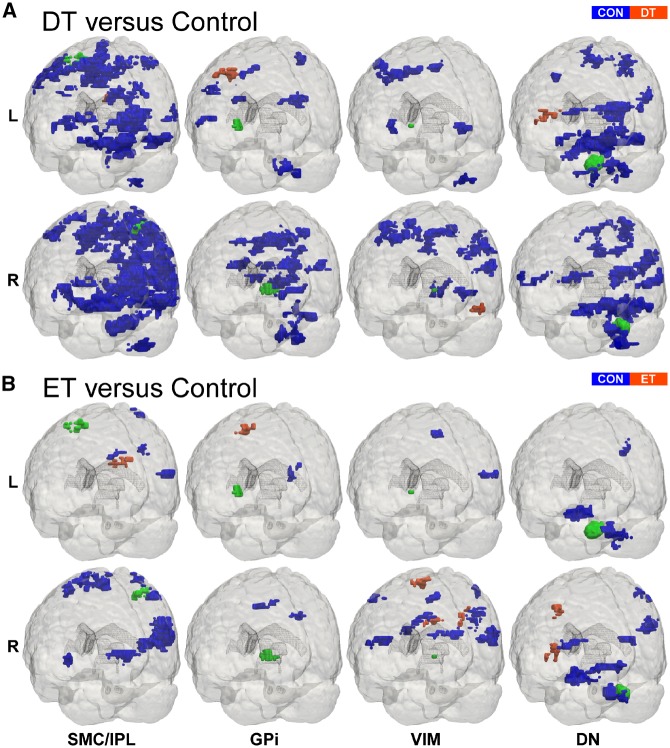
Figure 5.
Patient versus control FCΔ effects. 3D rendering (Madan, 2015) of whole-brain t-statistical maps comparing FCΔ for (A) dystonic tremor (DT) versus controls (CON) and (B) essential tremor (ET) versus controls (bottom). The x-axis denotes the seed region of interest in the SMC/IPL, GPi, VIM, and dentate nucleus (DN). The y-axis in each panel denotes the location of the seed region of interest in the left (L) and the right (R) hemispheres. In each panel, positive (red-orange) clusters, denote significantly increased FCΔ with the seed region of interest in the patient group (i.e. dystonic tremor or essential tremor) relative to controls, whereas negative (blue) clusters, denote significantly reduced FCΔ with the seed region of interest in patient groups relative to controls (P < 0.05 FWER-corrected).

