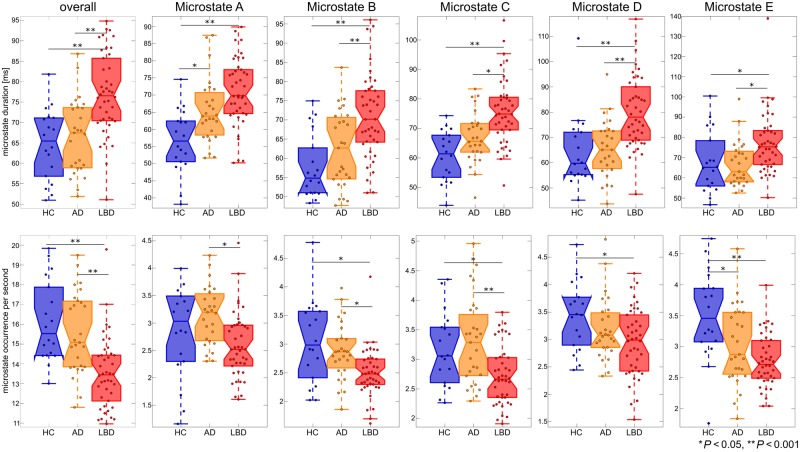
Figure 3.
Temporal microstate characteristics. Group comparison of microstate duration and occurrence per second overall and for each microstate class separately. P-values result from pairwise post hoc tests following univariate ANOVAs. See Tables 2 and 3 for detailed information on statistics. AD = Alzheimer’s disease; HC = healthy controls; LBD = Lewy body dementia.

