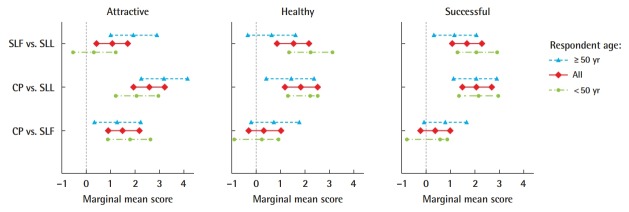
Fig. 3. Marginal mean score of various treatments.
Marginal differences between scores assigned to different treatments. The 95% confidence intervals (CI) around mean marginal differences for scores of attractiveness, health, and success assigned to each of the three photo types including the crude photo (CP), simulated upper lip lift (SLL), and simulated upper lip filler (SLF). The horizontal axes have been reduced in scale to improve visualization of the statistically significant marginal differences. Positive values indicate that the treatment listed first (left vertical axis) received a higher score in each of the nine clusters. Statistical significance indicated by all parameters that do not include zero marginal mean score.

