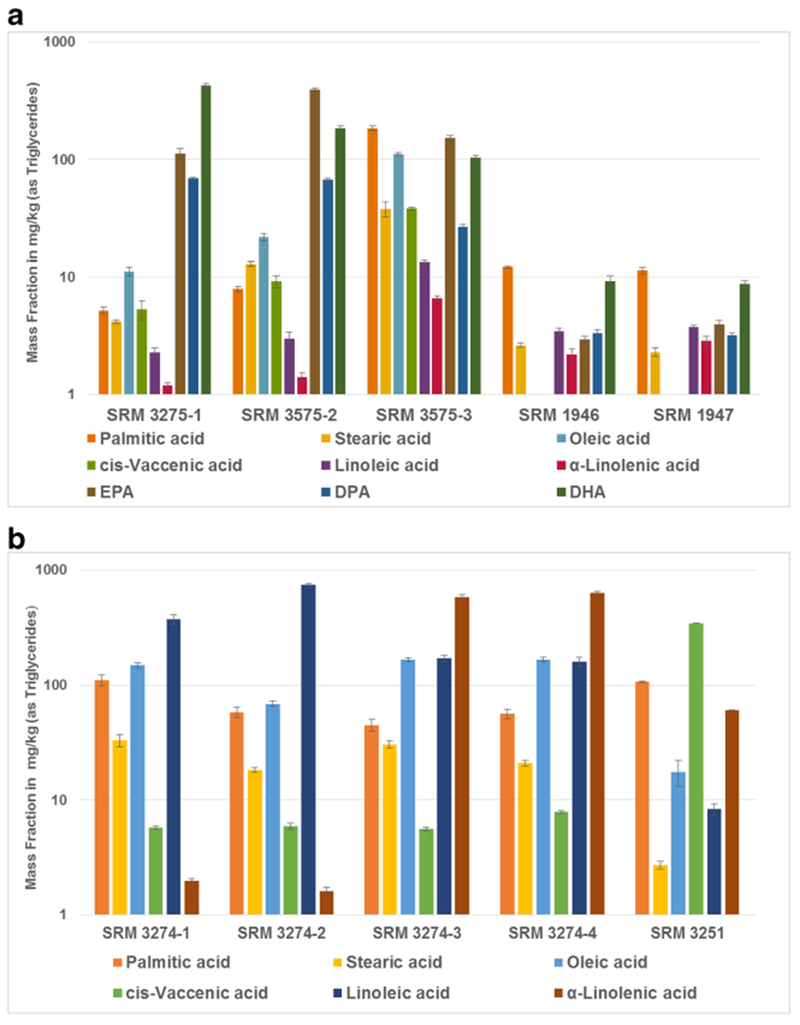
Fig. 5.

Bar graphs of the distribution of mass fractions of selected fatty acids (as triglycerides) in fish-matrix CRMs (a) and plant-matrix CRMs (b). Note the logarithmic scale for mass fractions. Error bars are the expanded uncertainties of the certified values with 95% confidence
