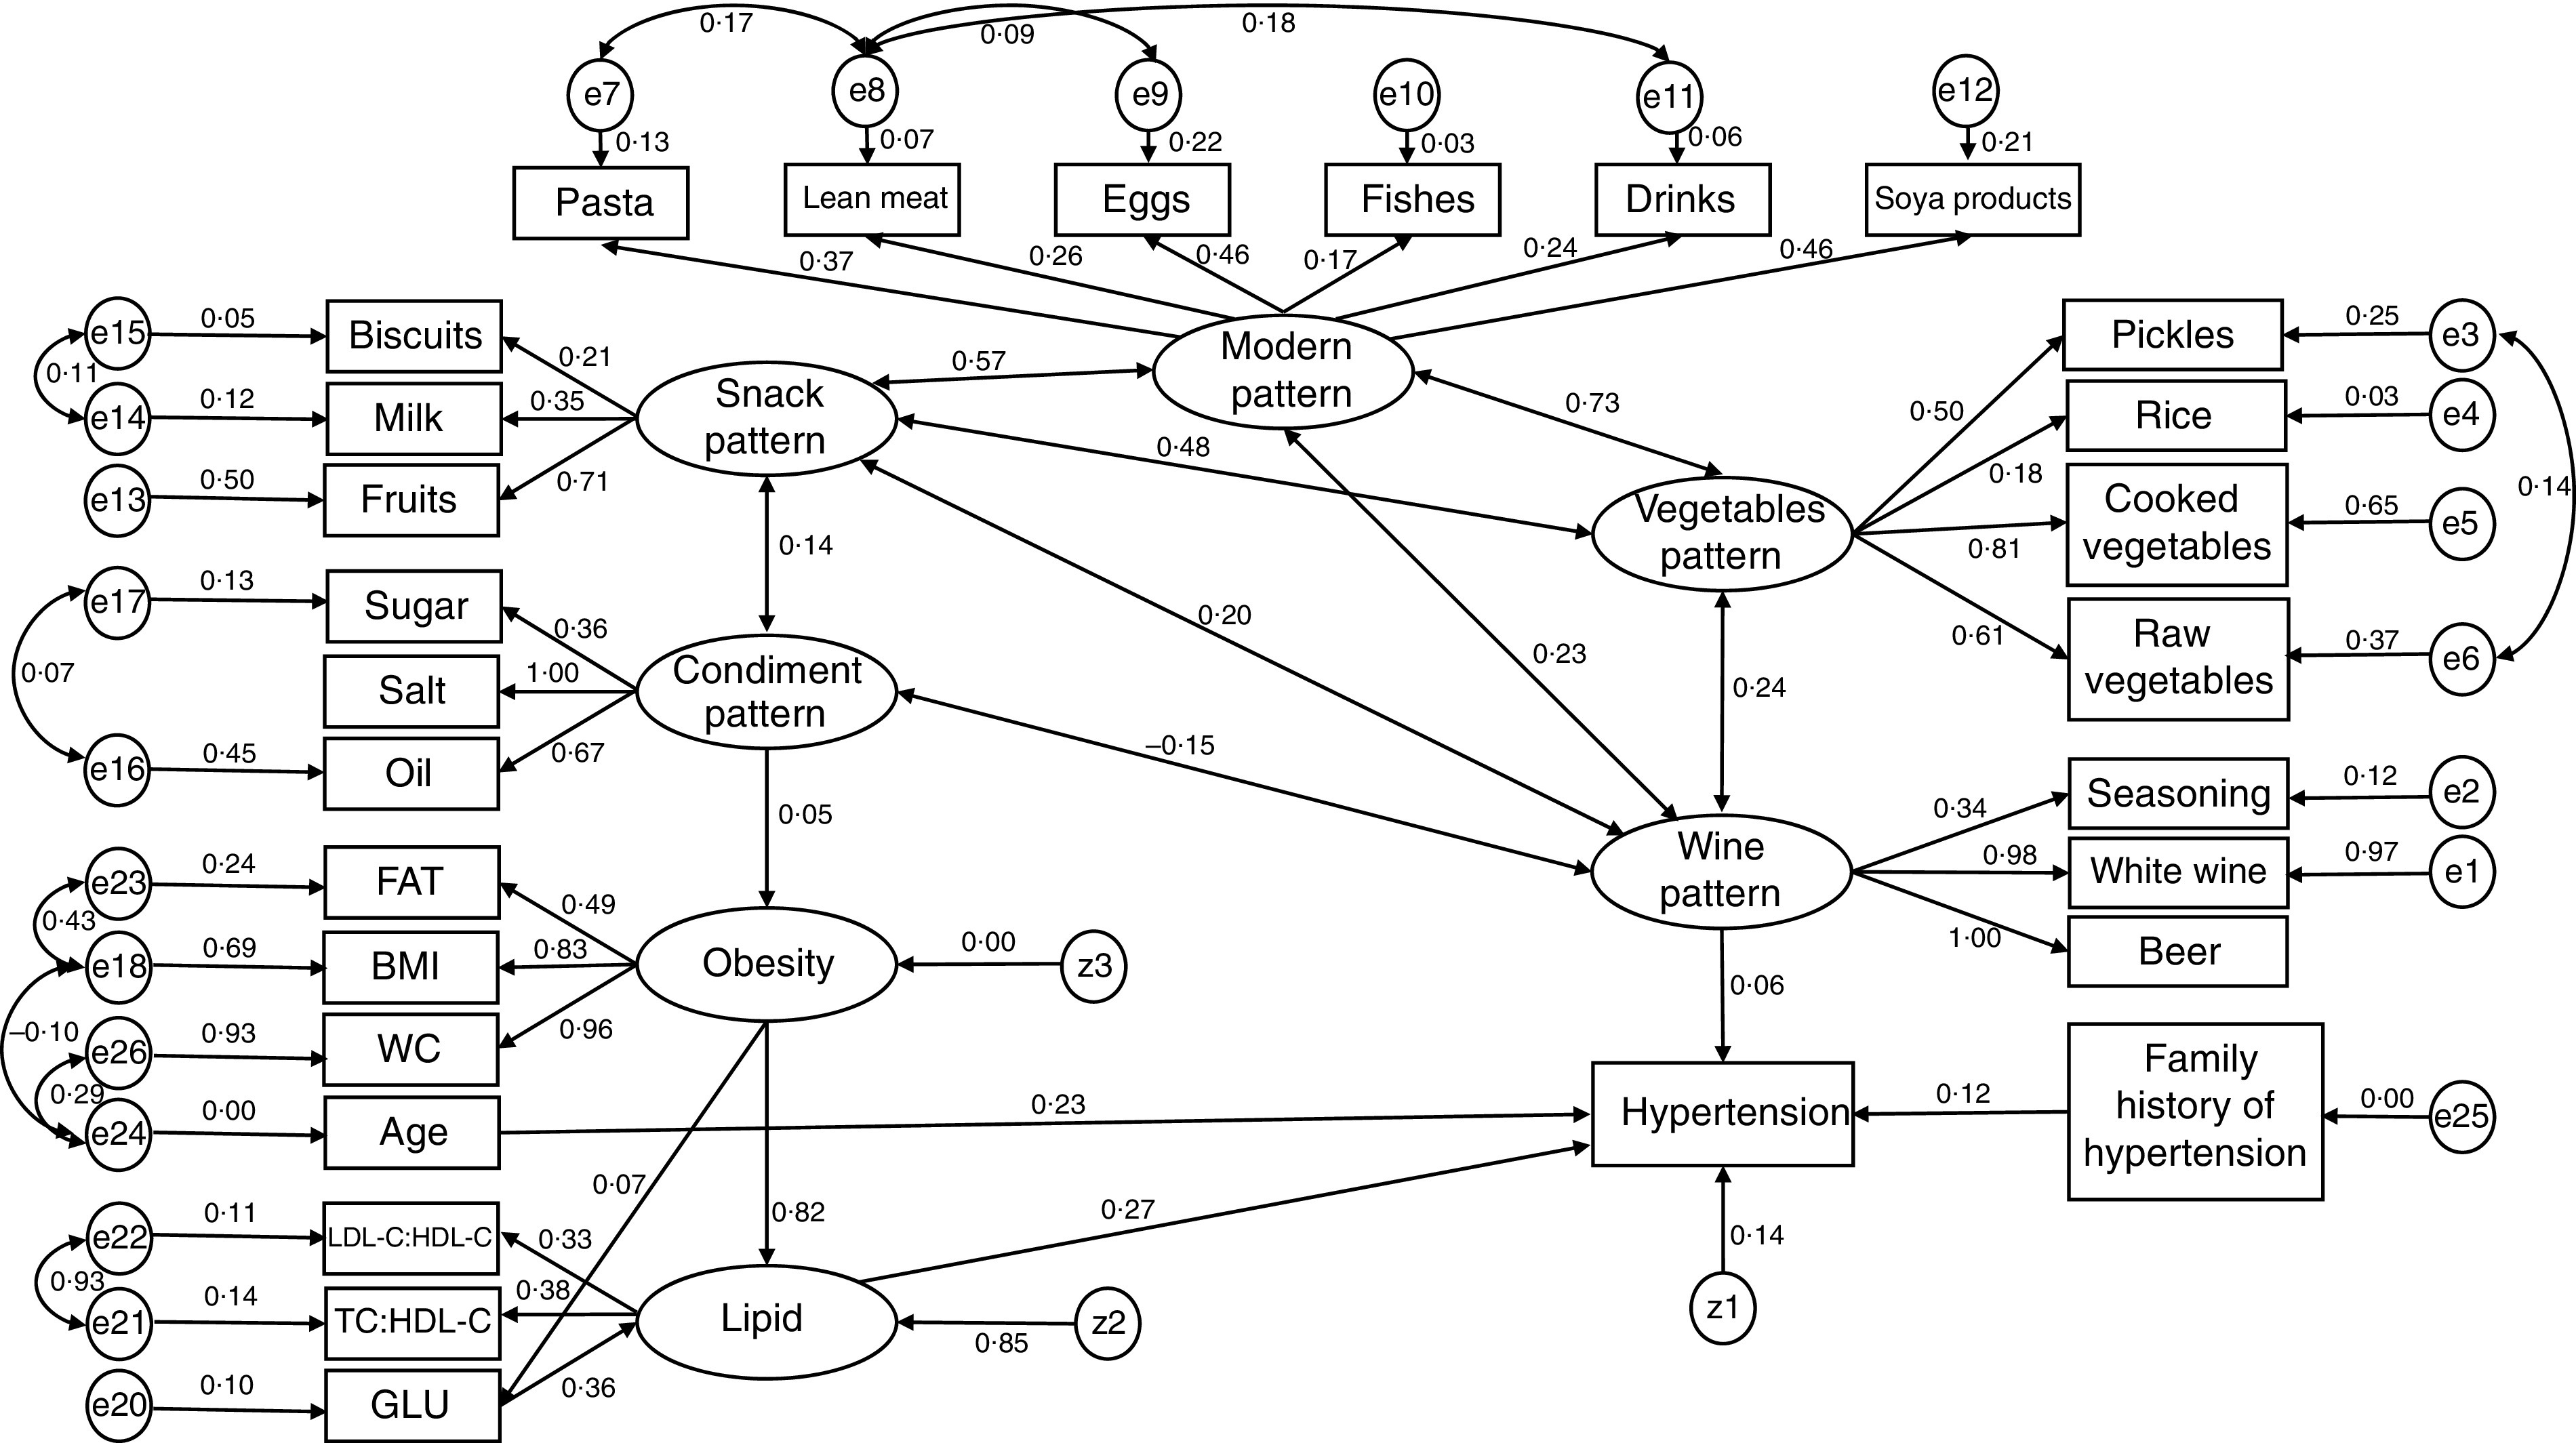
Fig. 1.

Structural equation model with standardized estimates for the relationship between dietary patterns and hypertension among participants aged 40–79 years (n 1326) from Jilin Province, China, enrolled in the International Chronic Disease Cohort, 2010–2011 (FAT, body fat percentage; WC, waist circumference; LDL-C, LDL-cholesterol; HDL-C, HDL-cholesterol; GLU, glucose; ei (i = 1, …, 26) and zj (j = 1, …, 3) are residuals)
