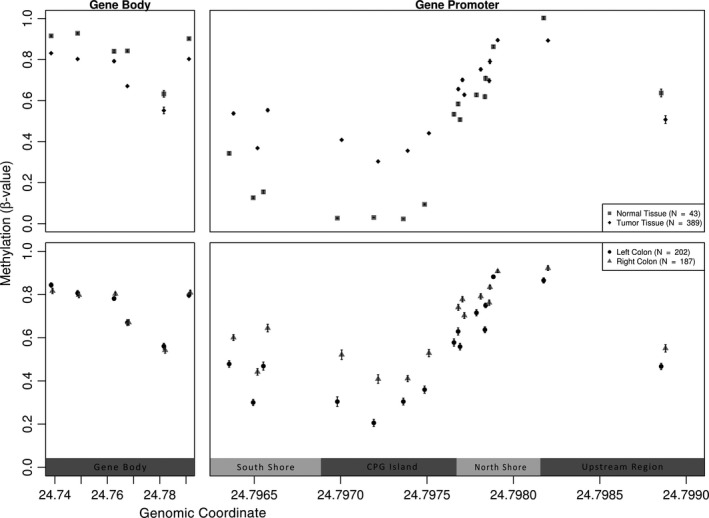
Figure 3.

Physical map of the 22 CpGs in GSDME, correlating the chromosomal location with the average methylation values. The upper panel corresponds to the tumor versus normal tissues, while the lower panel corresponds to the different anatomical subgroups (left‐ and right‐sided). Error bars indicate the standard error of the mean. A clear trend can be observed in mean methylation values; normal samples are higher methylated in the gene body as compared to tumor samples while the opposite occurs for CpGs in the promoter region. The last 2 CpGs, located upstream of the putative gene promoter region, show a methylation pattern similar to intragenic CpGs. In the anatomical subgroups, differential methylation is found only in promoter CpGs, with an increased methylation observed in the right‐sided group as opposed to the left‐sided
