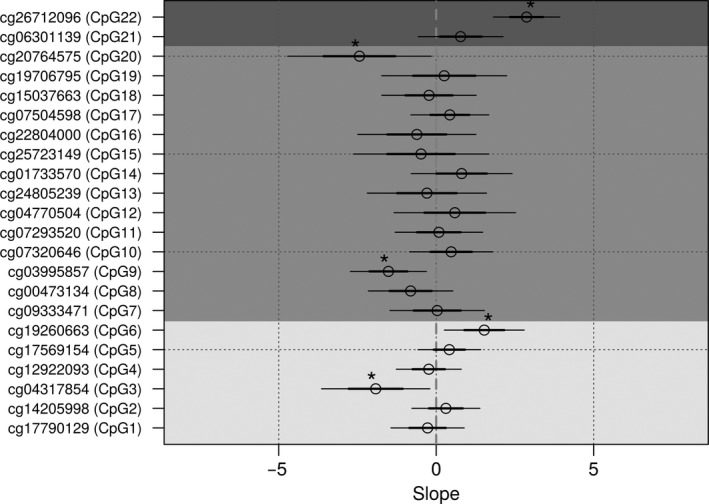
Figure 5.

Regression plot for probe methylation as a predictor for gene expression. Thick lines indicate ±1 standard error, thin lines indicate ±2 standard error, while * indicates probes with significant P‐values (<0.05) Light shading represents intragenic CpGs, dark shading represents putative promoter CpGs, while the darkest shading represents CpGs upstream of the putative promoter region
