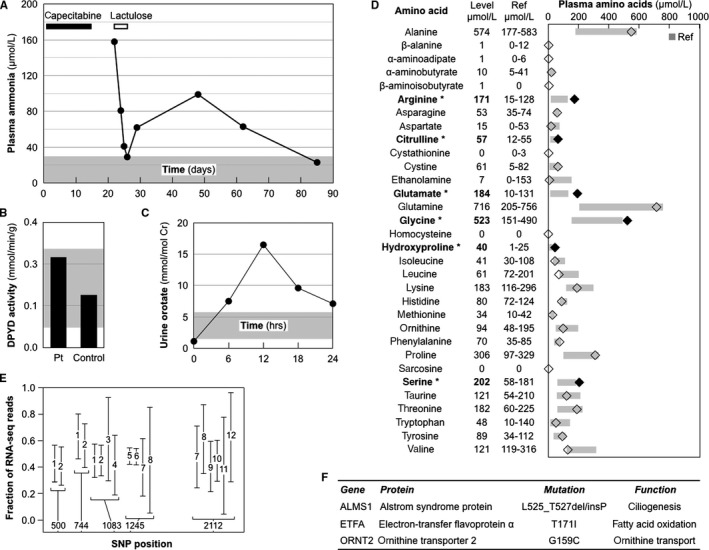
Figure 2.

Biochemical and genetic analysis of the patient. Normal ranges in panels A, B, C, and D appear in gray. A, Delayed plasma ammonia clearance. The patient received capecitabine on days 1‐14 (black bar), and lactulose on days 21‐23 (white bar). B, Normal dihydropyrimidine dehydrogenase (DYPD) activity in the patient (Pt). C, Excessive urine orotate after allopurinol challenge. D, Plasma amino acids. Levels were measured on 6 different days when plasma ammonia levels ranged from 19 to 180 µmol/L (average, 69 µmol/L). (Abnormal amino acid levels in bold and black diamonds). E, No effect of SLC7A7 splice donor polymorphism (position 1083) on its RNA levels. RNA sequencing data are shown from 12 acute myelogenous leukemias (1‐12) heterozygous for SNPs in at least one of 5 positions. F, Relevant genes with deleterious mutations
