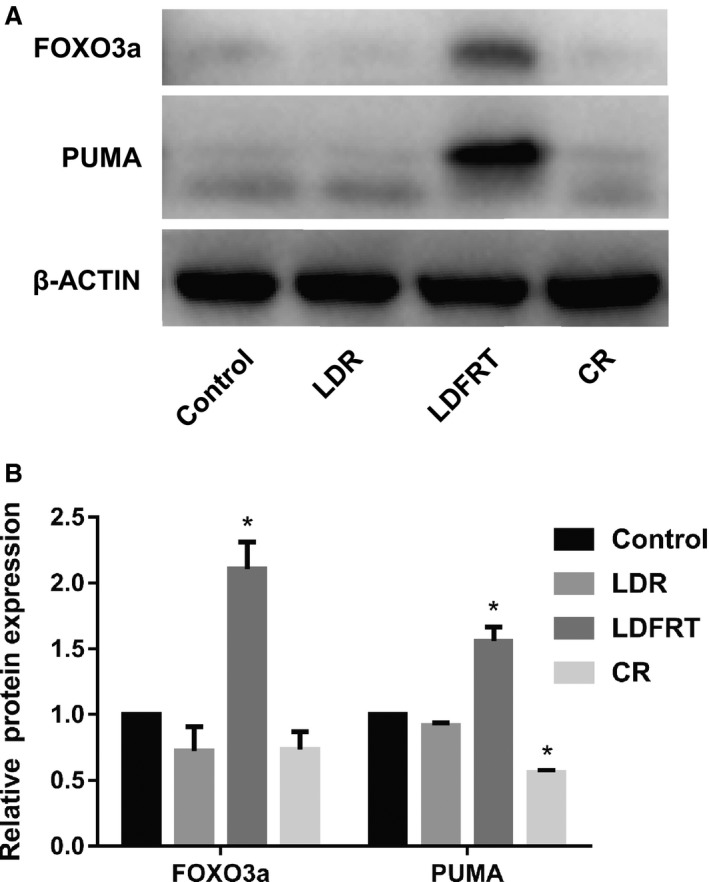
Figure 2.

Western blot analysis of the expression of FOXO3a and PUMA. A, Representative western blot. B, Quantification of FOXO3a and PUMA protein levels. After 24‐h pre‐radiation, the expression of FOXO3a and PUMA was examined. Data were expressed as the mean ± SD. Student’s t test was performed for comparison of the differences between two independent groups. *P < 0.05 (n = 3) vs control group
