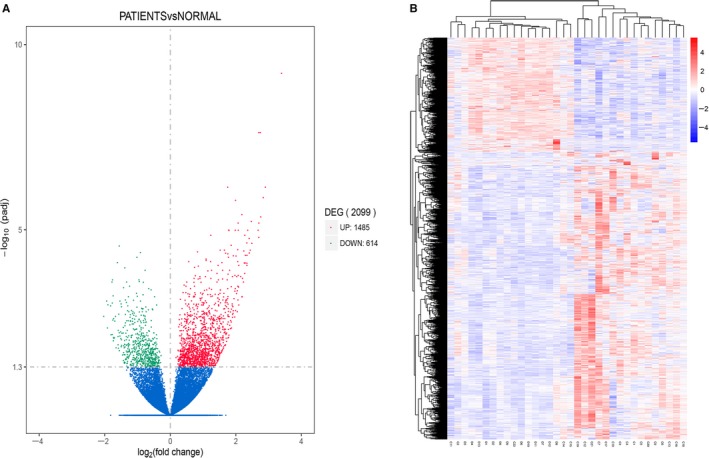
Figure 1.

Differentially expressed genes between PTCL patients and healthy controls. A, Volcano Plot of gene expression. The abscissa indicates the log2(foldchange) value and the ordinate indicates padj. The green part shows the lower expressed genes and the red part shows the higher expressed genes in PTCL patients compared with the healthy controls. B, Hierarchical clustering heat map. The abscissa indicates the sample number, the ordinate indicates different gene probe. The rectangular units indicate the sample gene expression level, which are normalized by log10 (FPKM + 1), and red indicate high expression, while blue indicate low expression. The right side of the graph shows the color scale and the corresponding log10 (FPKM + 1) value
