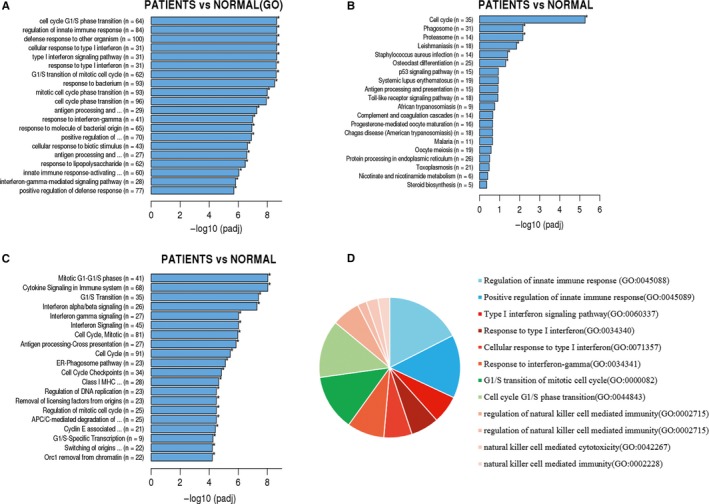
Figure 2.

Enrichment analysis of differentially expressed genes by GO (A), KEGG (B), and Reactome (C). The pie chart shows (D) that the differentially expressed genes were mainly related to innate immune response, IFN‐γ pathways and cell cycle regulation
