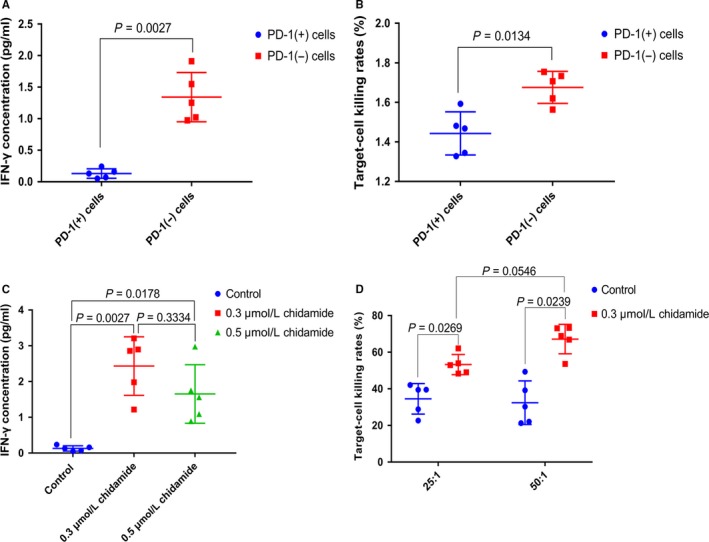
Figure 3.

The capability of secretion of IFN‐γ (A) and the ability of injuring of K562 cells (B) of PD‐1 (+) cells was weaker than PD‐1 (−) cells. (C, D) demonstrated that chidamide could significantly enhance the ability of producing IFN‐γ and cellular cytotoxicity of PD‐1 (+) cells. a. concentration of IFN‐γ(pg/mL): PD‐1 (+) cells 0.13 ± 0.03391, n = 5, PD‐1 (−) cells 0.9929 ± 0.1479, n = 5. b. target‐cell killing rates (%): PD‐1 (+) cells 32.46 ± 5.33, n = 5, PD‐1 (‐) cells 48.04 ± 3.837. n = 5. c. concentration of IFN‐γ (pg/mL): control 0.13 ± 0.03391, n = 5, 0.3 μmol/L chidamide 2.434 ± 0.3661, n = 5, 0.5 μmol/L chidamide 1.654 ± 0.3659, n = 5. d. targetcell killing rates (%): 25:1 group: control 34.56 ± 3.73, n = 5, 0.3 μmol/L chidamide 53.29 ± 2.459, n = 5,50:1 group: control 32.46 ± 5.33, n = 5, 0.3 μmol/L chidamide 67.17 ± 3.596, n = 5. The dots in the graphs represent biological repetitions
