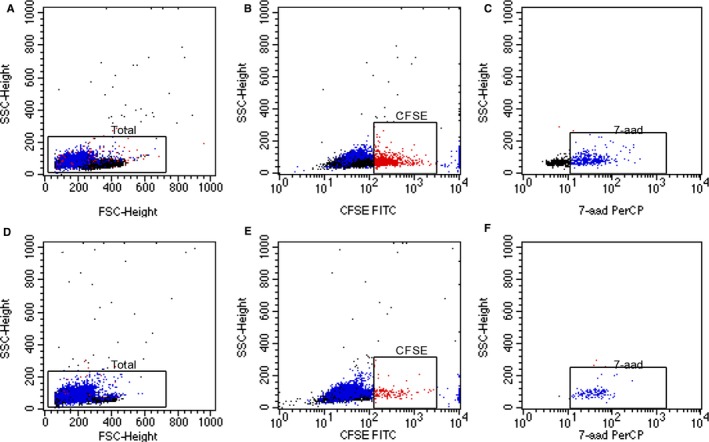
Figure 4.

Flow cytometric measurement of cytotoxicity of PD‐1 (+) cells before (A‐C) and after treated with 0.3 μmol/L chidamide (D‐F) by the CFSE/7‐AAD assay. Effector cells and targeted cells gated on the basis of FSC‐H vs SSC‐H (A, C). CFSE was used to identify target cells (red plots in figure B and D) and 7‐aad was used to detect target cell death in the gated area (blue plots in figure C and F)
