
Figure 3.
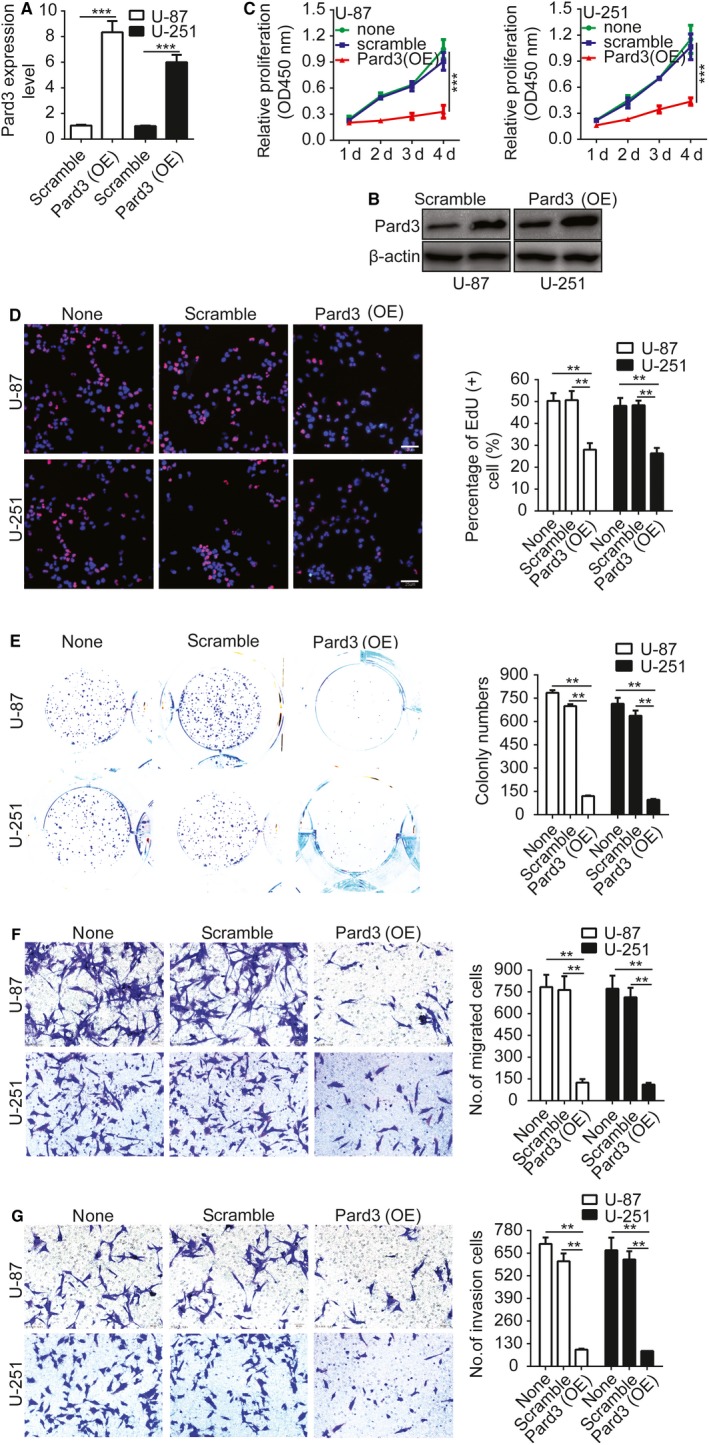
Overexpression of Pard3 inhibits glioma cell proliferation, migration, and invasion. A and B, The efficiency of construct overexpressing Pard3 in U‐87 and U‐251 cells was verified by qRT‐PCR and Western blotting. C, Growth curves for Pard3‐shRNA and scramble control‐infected cells, as measured by CCK‐8 assay. The results are presented as the mean ± SD of seven independent experiments. D, Pard3 overexpression inhibited proliferation in U‐87 and U‐251 cells. Percentage of EdU (+) is expressed in the right panel. E, Overexpression of Pard3 inhibited colony formation in U‐87 and U‐251 cells. Quantification of colony numbers is expressed in the right panel. F and G, Transwell migration and invasion assays shows that overexpression of Pard3 inhibits cell migration and invasion. The numbers of migrating and invading cells are summarized in the right panel. The results are expressed as the mean ± SD of five independent experiments. Bars: 50 μm. Statistical significance was tested using one‐way ANOVA followed by Dunnett's tests for multiple comparison and two‐tailed t‐tests. **P < 0.01, ***P < 0.001. ANOVA, analysis of variance; CCK‐8, cell counting Kit‐8; none, non infected cells; Pard3, partitioning defective protein 3; SD, standard deviation