Figure 6.

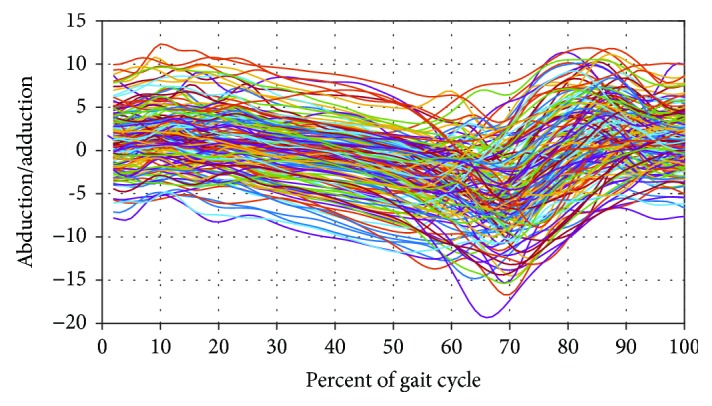
Illustration of high dimensionality and variability. The graph shows the graph of a sample of 160 distinct asymptomatic abduction/adduction waveforms, each composed of 100 measurement points.

Illustration of high dimensionality and variability. The graph shows the graph of a sample of 160 distinct asymptomatic abduction/adduction waveforms, each composed of 100 measurement points.