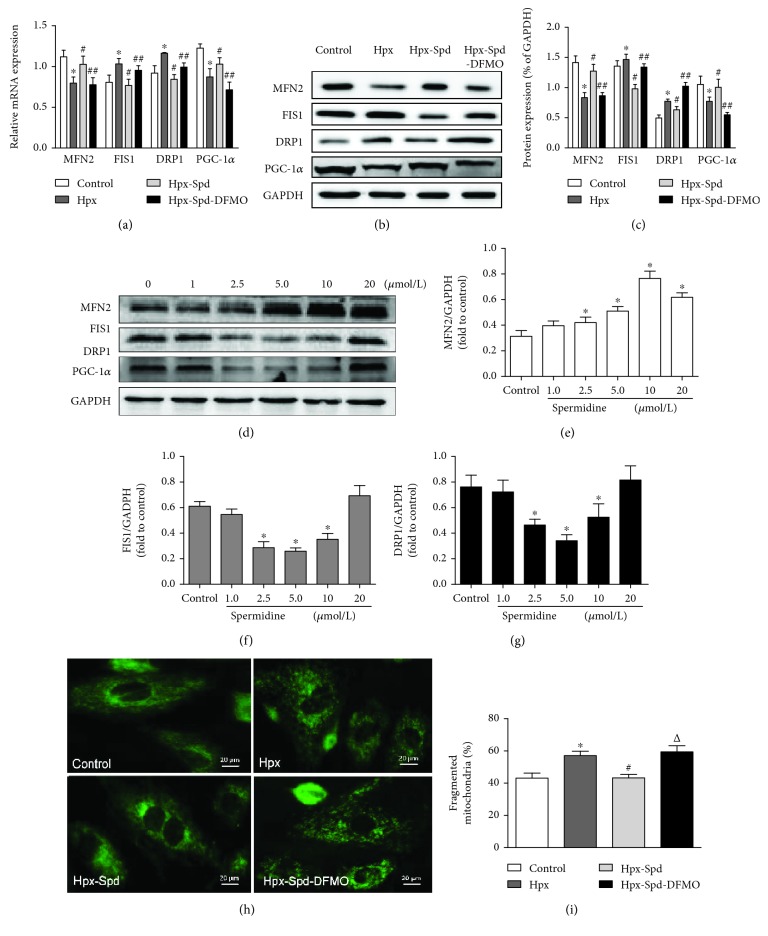
Figure 5.
Effects of SPD on mitochondrial biogenesis and fission/fusion dynamics in the offspring myocardium and NRCMs exposed to hypoxia. (a) mRNA expression levels of myocardial MFN2, FIS1, DRP1, and PGC-1α were determined by qRT-PCR; GAPDH was used as an internal control (n = 6). (b) Protein levels of MFN2, FIS1, DRP1, and PGC-1α in the offspring myocardium collected from the control, Hpx, Hpx-Spd, and Hpx-Spd-DFMO groups were assessed by western blotting. (c) Quantification of MFN2, FIS1, DRP1, and PGC-1α protein levels normalized to GAPDH in each group (n = 4). Data are shown as the mean ± SEM. ∗ P < 0.05 versus control, # P < 0.05 versus the Hpx group, and △ P < 0.05 versus the Hpx-Spd group. (d) Western blotting showed a dose-dependent effect of SPD (0, 2.5, 5, 10, and 20 μmol) on the protein levels of MFN2, FIS1, and DRP1 in NRCMs after exposure to hypoxia. Quantitative analysis of (e) MFN2, (f) FIS1, and (g) DRP1 protein levels normalized to that of GAPDH. Data are shown as the mean ± SEM. ∗ P < 0.05 versus the control group (0 μmol/L SPD treatment; n = 6). (h) Detection of fused and fragmented mitochondria in NRCMs by MitoTracker Green staining (magnification, 400x). (i) The percentage of fragmented mitochondria. n = 6 for each group. Data are shown as the mean ± SEM. ∗ P < 0.05 versus the control group, # P < 0.05 versus the Hpx group, and △ P < 0.05 versus the Hpx-Spd group.

