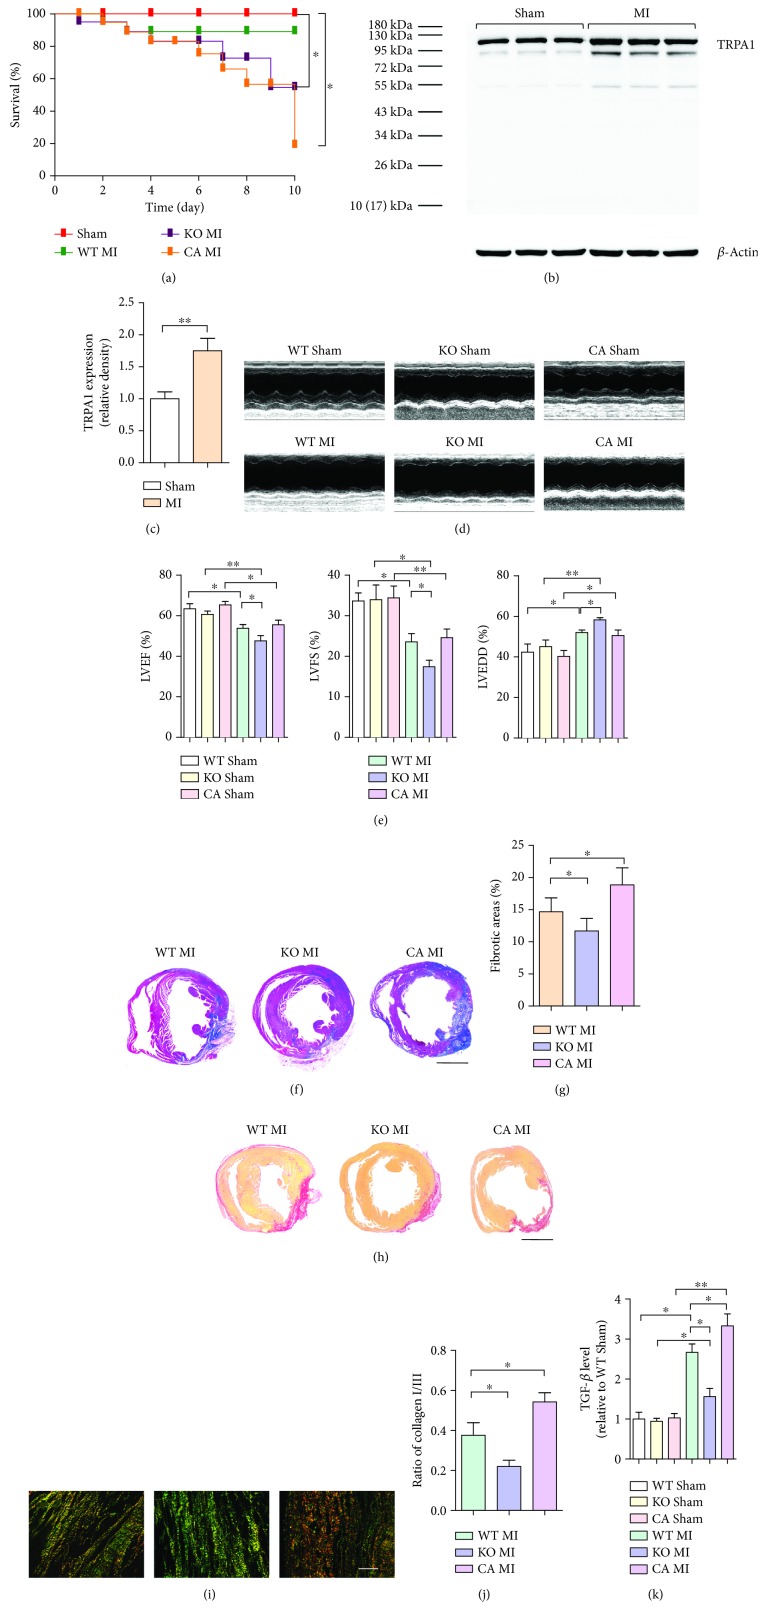
Figure 1.
Effect of TRPA1 on the course of cardiac fibrosis after MI injury. (a) Survival curves of Trpa1+/+ (WT), Trpa1−/− (KO), and CA-pretreated WT (CA) littermates after sham or permanent coronary ligation surgery (MI). n = 20 per group. (b and c) Western blot analysis and quantification of the TRPA1 protein level in the ventricles of MI-injured mice. Molecular weights in kDa are shown to the right of the blots. n ≥ 3 per group. (d) Representative M-mode echocardiography images of mice. (e) Measurement of the left ventricular ejection fraction (LVEF), left ventricular fractional shortening (LVFS), and left ventricular end-diastolic dimension (LVEDD). n ≥ 10 per group. (f) Representative images of Masson's trichrome staining. Red, viable myocardium; blue, fibrosis due to infarction damage (scale bar = 1 mm). (g) Quantitative analysis of the fibrotic area (blue). n ≥ 5 per group. (h) Picrosirius red staining for collagens in sections of myocardium as observed via optical microscopy (scale bar = 1 mm). (i) Under polarized light, the orange and red colors indicate type I collagen deposition and the green and yellow colors indicate type III collagen deposition in the myocardial infarct region (scale bar = 25 μm). (j) Collagen subtype ratio in the infarct region as calculated by image analysis. n ≥ 5 per group. (k) The TGF-β level in the myocardial tissue lysis supernatant was quantified by ELISA. n ≥ 4 per group. The error bars represent the means ± s.e.m.∗ P < 0.05 and ∗∗ P < 0.01. The data are representative of the results of three or more independent experiments.

