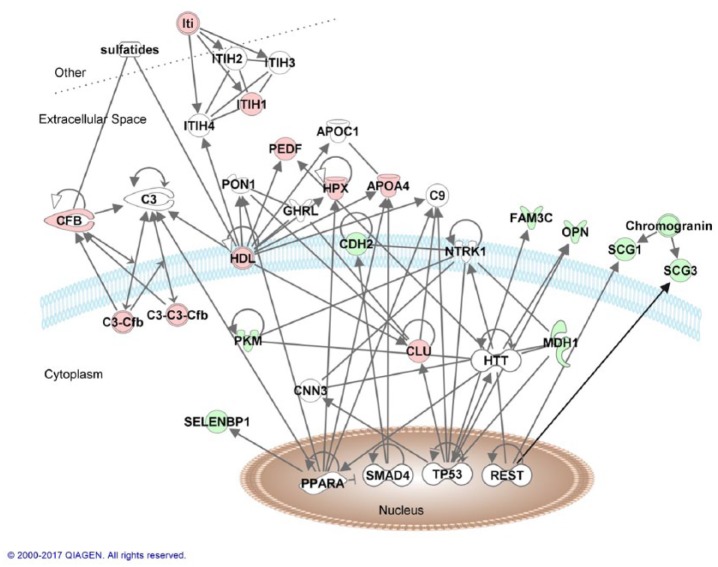
Figure 3.
Top network from ingenuity pathway analysis with 14 of the differentially expressed proteins (red = upregulated, green = downregulated) and proteins that are directly associated with them (white molecules). The different lines correspond as follows: only line = binding, filled closed arrow = acts on, closed arrow = translocation, open arrow = reaction, and butt line = inhibition.

