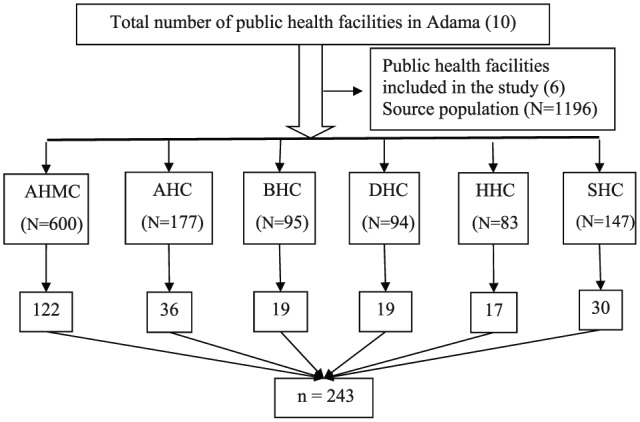
Figure 1.

Schematic presentation of sample size allocation.
N: total number of patients with diarrhea at selected public health facilities; n: sample size.

Schematic presentation of sample size allocation.
N: total number of patients with diarrhea at selected public health facilities; n: sample size.