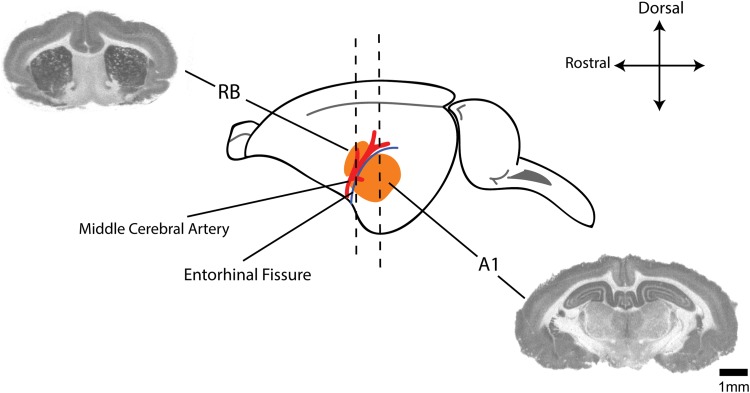
Figure 2.
Anatomical distribution of regions of interest. Schematic showing anatomic relationship between the dorsal rostral belt (RB) and primary auditory cortex (A1; both in orange) including middle cerebral artery (red) and the entorhinal fissure (blue line) as gross anatomic landmarks.35,36 Accompanied are autoradiographic coronal sections through representative areas used for RB and A1 binding analysis.37 Scale bar represents 1-mm increments.

