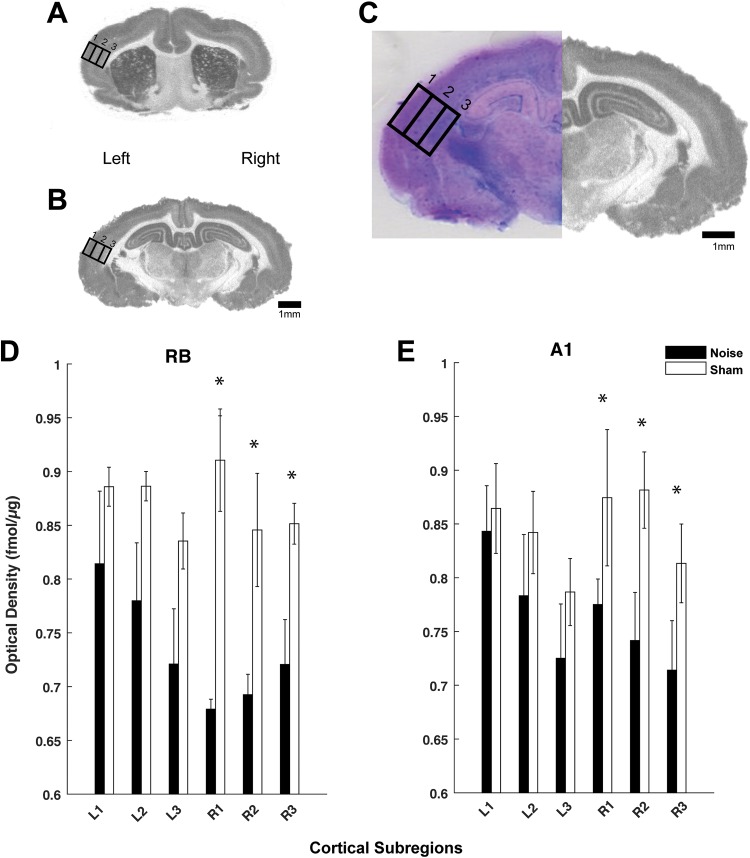
Figure 3.
mAChR expression is decreased in A1 and rostral belt (RB)following noise exposure. Autoradiographic images showing [3H]scopolamine binding in representative coronal sections through RB (A) and A1 (B) on left (noise exposed) and right hemispheres. Panel C shows a high magnification view of A1 (of panel B) with standardized areas of analysis drawn over the 3 cortical subregions: supragranular (1), granular (2), and infragranular (3) with Giemsa counterstained image to verify layers. Quantified optical density measures for [3H]scopolamine binding are shown in the bar graphs for both the RB (D) and A1 (E) comparing left (L) and right (R) cortical hemispheres between both groups (noise: black; sham: white). Significant differences between noise and sham controls were noted in the right hemisphere (contralateral to noise exposure) versus left (* P < .05; standard deviation). Scale bars represent 1-mm increments. mAChR indicates muscarinic acetylcholine receptor.

