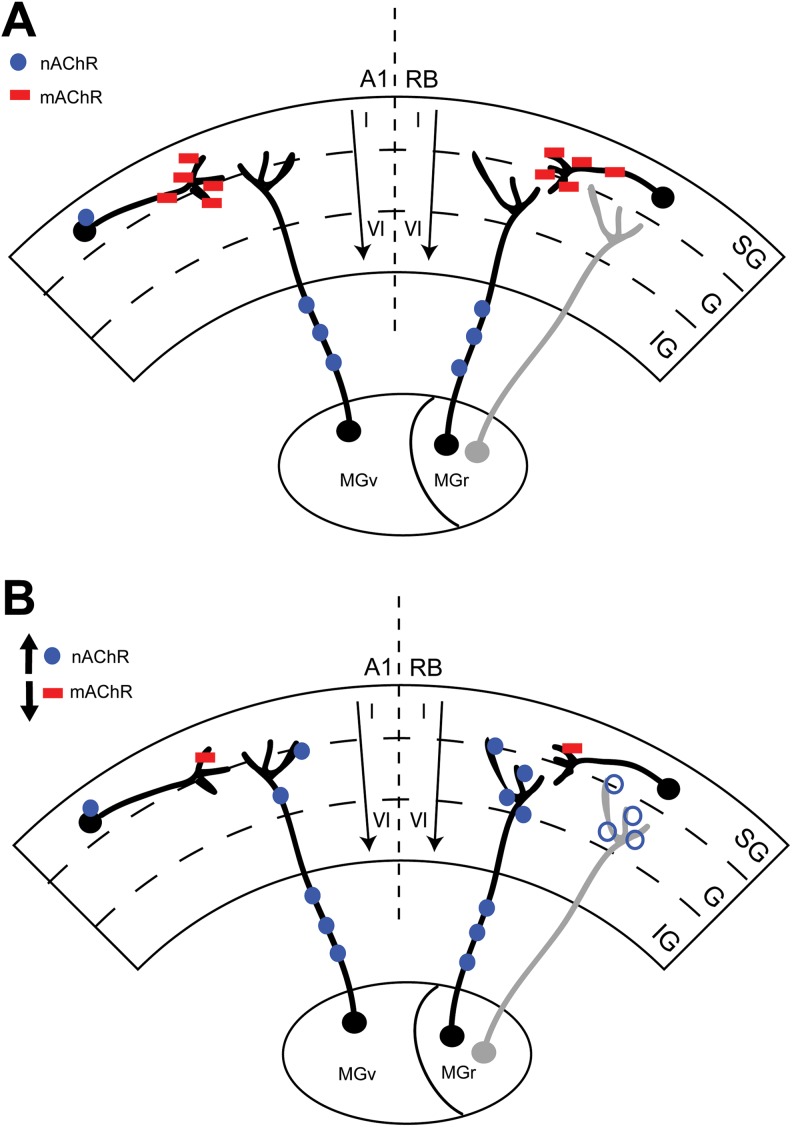
Figure 7.
Noise alters ACh receptor expression in A1 and rostral belt (RB). Cartoon schematic summarizing the overall effects of noise-induced TTS on both mAChR (red squares) and nAChR (blue circles) expression in RB and A1. Panel A shows the intact brain with known thalamocortical projections having separate/discrete A1 (MGv) and RB (MGr) projections. Note the expected distribution of cholinergic receptors within the intact cortices and thalamocortical projections. Panel B summarizes the current results and changes in AChR expression following noise exposure and a TTS in hearing. Note the decrease in mAChR expression in both A1 and RB at the cortical level on presumed cholinergic interneurons. Despite a nonsignificant upward trend in expression in A1, nAChR expression increases only in contralateral (right) RB at the 2 outermost cortical subregions (SG, supragranular; G, granular; IG, infragranular) in the ipsilateral (light gray) RB (open blue circle). mAChR indicates muscarinic acetylcholine receptor; MGr, medial geniculate; MGv, ventral geniculate; nAChR, nicotinic acetylcholine receptor; TTS, temporary thresholds shifts.

