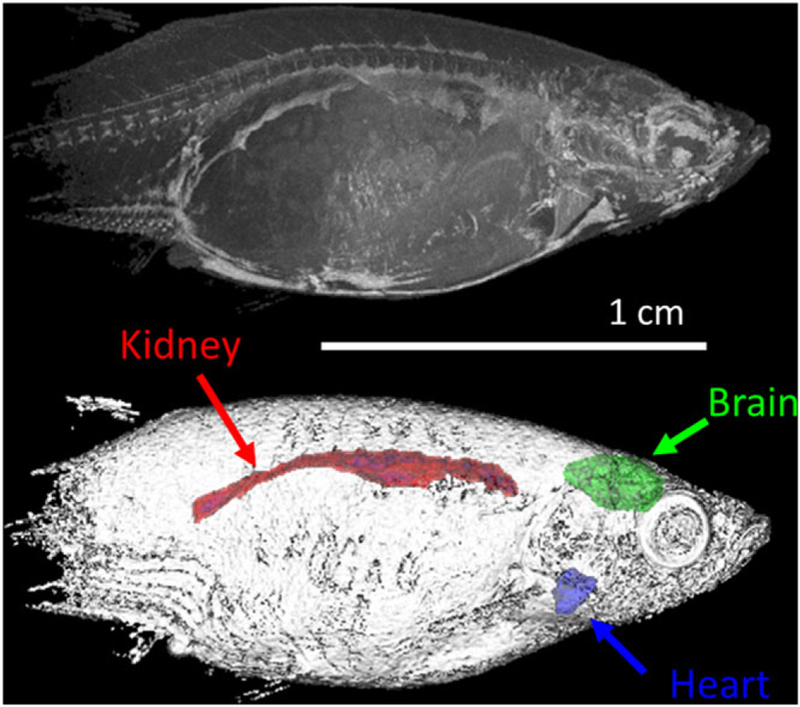
FIGURE 11.

Organ segmentation from the 3D image shown in Figure 3. Top panel: maximum intensity projection of sagittal view of the zebrafish. Bottom panel: volume composite rendering of the zebrafish specimen with segmented brain, heart, and kidney. The image is recorded with 50 μm/pxl and segmented organ volumes are 4.5 mm3, 0.82 mm3, and 4.9 mm3 for the brain, heart, and kidney, respectively
